A branch of computer science known as “data science” is specifically concerned with transforming data into information and drawing valuable conclusions from it. Data science is so well-liked because the kinds of insights it enables us to get from the data at hand have produced some significant improvements in numerous goods and businesses. We can ascertain a customer’s preferences, the possibility that a product will flourish in a specific market, etc. using these insights.
Data Analytics | Data Science |
Data Science includes data analytics as a subset. | Data Analytics, Data Mining, Data Visualization, etc. are just a few examples of the many subsets that make up the larger field of data science. |
Data analytics seeks to highlight the specifics of discovered insights. | Finding significant insights from enormous datasets and coming up with the best potential solutions to solve business problems are the two main objectives of data science. |
Just calls for simple programming languages. | Need familiarity with high-level programming languages. |
It just focuses on identifying the answers. | In addition to focusing on finding answers, data science also makes future predictions using historical patterns or insights. |
A data analyst’s responsibility is to analyse data so that decisions can be made. | It is a data scientist’s responsibility to provide clear and meaningful data visualisations from unprocessed data. |
Â
The massive data sets must be cleaned up and transformed into a format that data scientists can use. For improved results, it’s crucial to deal with the redundant data by deleting illogical outliers, corrupted records, missing values, inconsistent formatting, etc.
For data cleaning and analysis, Python modules like Matplotlib, Pandas, Numpy, Keras, and SciPy are frequently used. These libraries are used to load, prepare, and perform efficient analyses on the data. For instance, the “Student” CSV file contains details about the students of a certain institute, including their names, standards, addresses, phone numbers, grades, and other information.
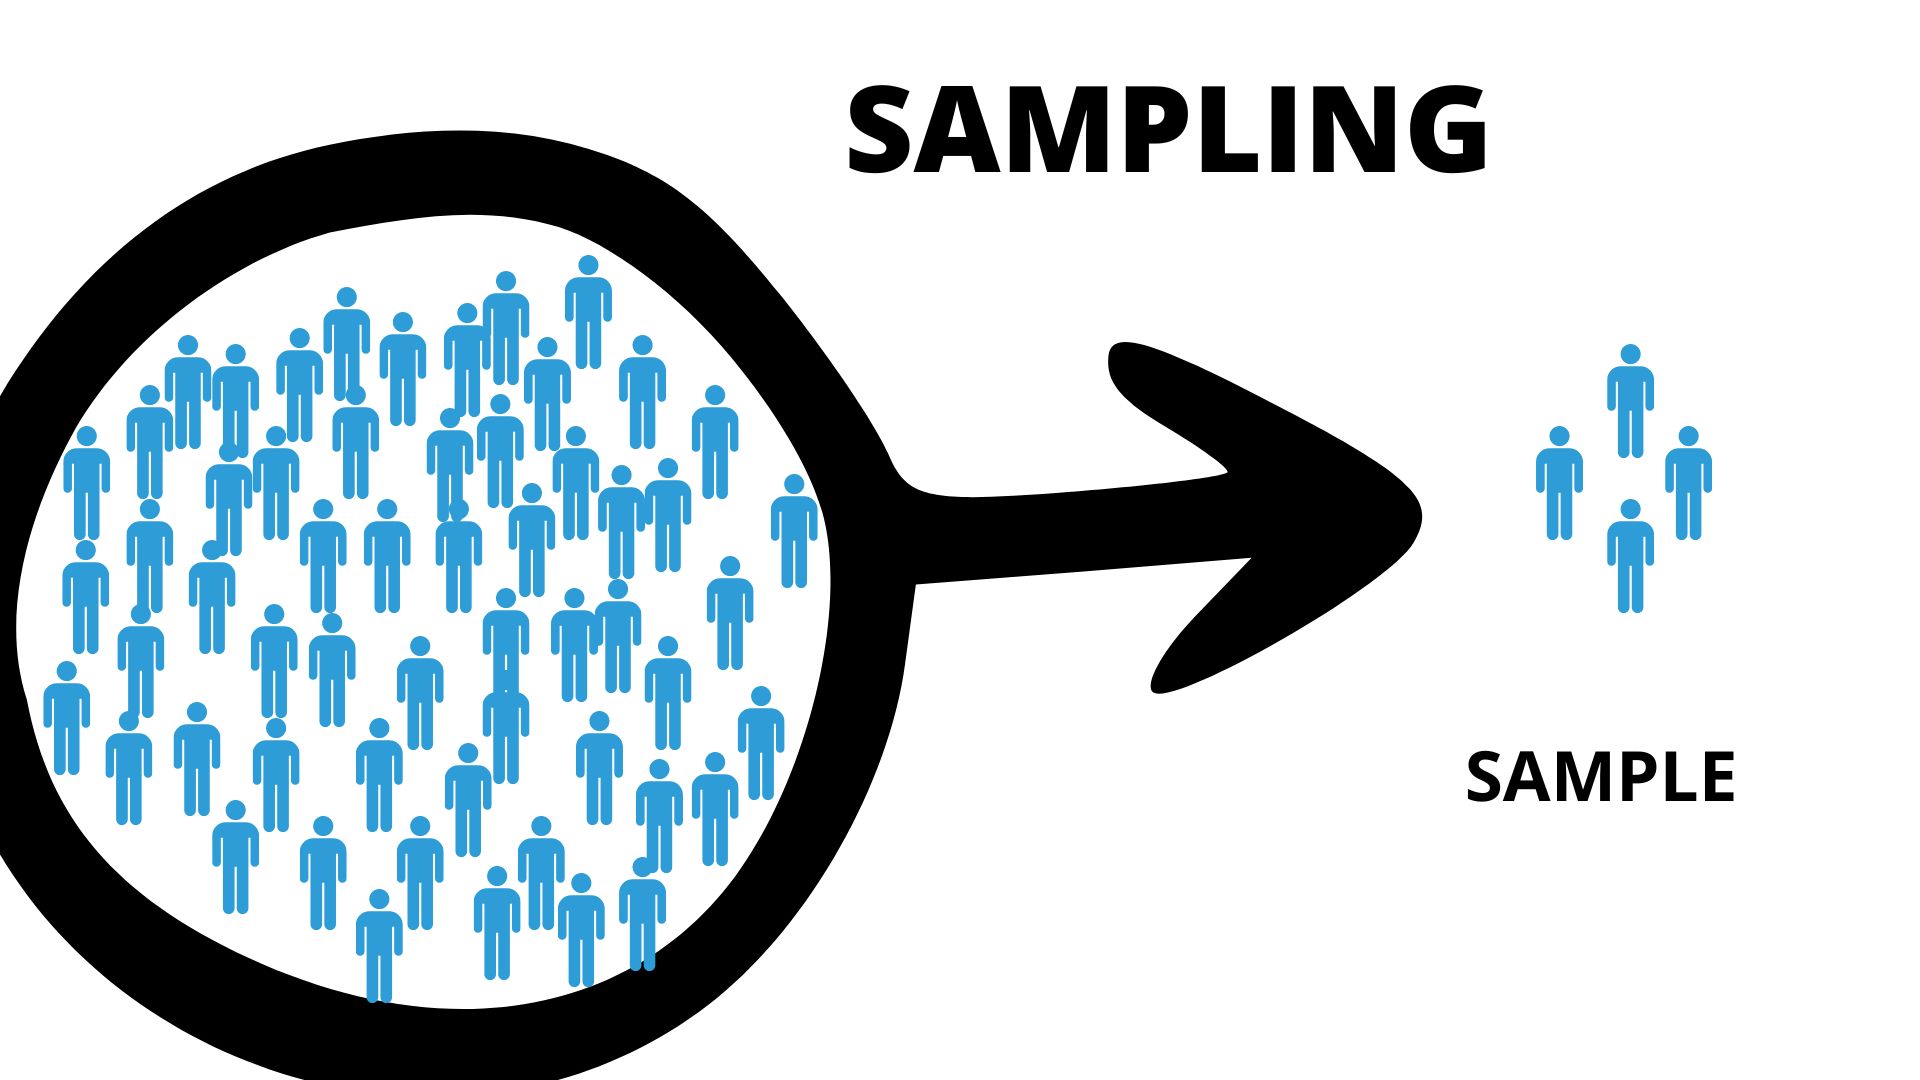
Especially when dealing with bigger datasets, data analysis cannot be performed on the entire volume of data at once. It becomes essential to collect certain data samples that may be analysed and utilised to represent the entire population. While doing this, it is imperative to carefully choose sample data from the enormous data collection that accurately reflects the complete dataset.
Based on the use of

statistics, sampling strategies may be broadly divided into two categories:
Techniques for probability sampling include stratified sampling, simple random sampling, and clustered sampling.
Techniques for non-probability sampling include convenience sampling, quota sampling, snowball sampling, and others.
The logit model, or logistic regression, is another name for it. With the help of a linear combination of predictor variables, it is a technique for predicting the binary result.
There are three different categories of bias in the sampling process, which are:
Selection bias
Under coverage bias
Survivorship bias
Â
One well-liked supervised machine learning algorithm is the decision tree. Regression and classification are its two principal applications. It enables the division of a dataset into more manageable parts. Both category and numerical data are capable of being handled by the decision tree.
Â
Many different decision trees are used to create a random forest. The random forest puts all the trees together if the data is divided into many packages and a decision tree is created for each package of data.
A model that is overfitted ignores the wider picture and is only tuned for a relatively tiny quantity of data. To prevent overfitting, there are three basic strategies:
Based on user preferences, a recommender system predicts how a user will evaluate a certain product. It can be divided into two sections:
Teamwork in Filtering
For instance, Last.fm suggests songs based on what other users who share your interests frequently listen to. Customers may get the following message along with product recommendations after completing a purchase on Amazon: “Users who bought this also bought…”
Filtering based on content
As an illustration, Pandora uses a song’s characteristics to suggest songs with related characteristics. Instead than focusing on who else is listening to music, we are here focusing on the substance.
R is utilised for data visualisation because it comes with a large number of built-in functions and libraries. Ggplot2, Leaflet, Lattice, and other libraries are examples of them.
R supports feature engineering as well as exploratory data analysis. Almost every type of graph may be produced with R. R makes it simpler to customise graphics than Python.
Collaborative filtering uses a variety of viewpoints, data sources, and agents to find the right patterns.
The experimental design includes the power analysis as a crucial component. It assists you in figuring out the sample size needed to conclusively determine the impact of a certain size on a cause. Additionally, it enables you to use a certain probability under a sample size restriction.The experimental design includes the power analysis as a crucial component. It assists you in figuring out the sample size needed to conclusively determine the impact of a certain size on a cause. Additionally, it enables you to use a certain probability under a sample size restriction.
Underfitting can result from bias, which is an inaccuracy that is introduced into your model as a result of a machine learning algorithm’s oversimplification.
The Bayes Theorem is the foundation of the Naive Bayes Algorithm paradigm. It gives the likelihood of an event. It is predicated on prior knowledge of circumstances that might be connected to that particular incident.
When using A and B as the variables in a random experiment, AB testing was performed. This testing technique’s objective is to identify adjustments that need be made to a website in order to maximise or improve a strategy’s results.
Â
For understanding linear transformations, use eigenvectors. A covariance matrix’s or correlation’s eigenvectors must be computed by data scientists. The directions that a particular linear transformation acts by compressing, flinging, or stretching are known as eigenvalues.
Machine learning has been transformed by a unique group of algorithms called artificial neural networks (ANN). It aids in your ability to adjust to shifting input. Consequently, the network produces the best outcome without changing the output criterion.
The foundation of neural net training is back-propagation. The process of fine-tuning a neural network’s weights is based on the error rate recorded in the previous epoch. By enhancing the model’s generalisation, proper tuning lowers error rates and increases the model’s dependability.
A machine learning technique called random forest enables you to complete all kinds of regression and classification tasks. Outlier values and missing values are both treated using it.
When picking people, groups, or data to be evaluated, there is no precise randomization implemented, which results in selection bias. It implies that the population that was intended for analysis is not accurately represented by the sample that was used.
An important unsupervised learning technique is K-means clustering. It is a method for categorising data using a specific set of clusters known as K clusters. It is utilised for grouping to determine data similarity.
A p-value allows you to assess the significance of your findings while performing a hypothesis test in statistics. It is an integer in the range of 0 and 1. You can indicate the strength of a given result based on the value.
A subcategory of machine learning is deep learning. It focuses on algorithms that were influenced by the artificial neural networks construction (ANN).
You can collect social media data using Facebook, twitter, Instagram’s API’s. For example, for the tweeter, we can construct a feature from each tweet like tweeted date, retweets, list of follower, etc. Then you can use a multivariate time series model to predict the weather condition.
You need to update an algorithm in the following situation:
Why is Normal Distribution Important?
A set of continuous variables distributed along a normal curve or in the form of a bell curve is known as a normal distribution. You may think of it as a continuous probability distribution that’s helpful for statistics. When using the normal distribution curve, it is helpful to examine the variables and their interactions.
Python has a robust package called pandas that makes it better suited for text analytics. While R lacks this functionality, it enables the use of high-level data analysis tools and data structures.
