Table of Contents
Toggle
If you are starting your journey in data cleaning with Python, the first step is
understanding what Pandas in Python really is. In this section, we explain the basics of
Pandas, DataFrame (df), and why it is the most popular tool for data manipulation
and data cleansing in Python.
Answer: Pandas is an open-source Python library used for
data analysis, cleaning, and manipulation. It provides flexible data
structures like Series (1-D) and DataFrame (2-D) to work with
structured data (tables, CSVs, Excel, SQL queries).
Answer: Pandas is mainly used for:
Answer: In simple terms, Pandas are powerful Python tools that help turn raw data into clean, structured tables so analysts can focus on insights instead of messy datasets.
Answer: In Pandas, df is a common variable name used for
a DataFrame. A DataFrame is a 2D table of rows and columns, just like an
Excel sheet or SQL table.
import pandas as pd
df = pd.read_csv("data.csv")
print(df.head())  # displays first 5 rows
Answer: Pandas is the library, while df
(DataFrame) is the data structure created using Pandas to store and
manipulate tabular data.
📘 Learn more about Pandas Data Cleaning in the next section: Handling Missing Values with Pandas.
Go to Next Section →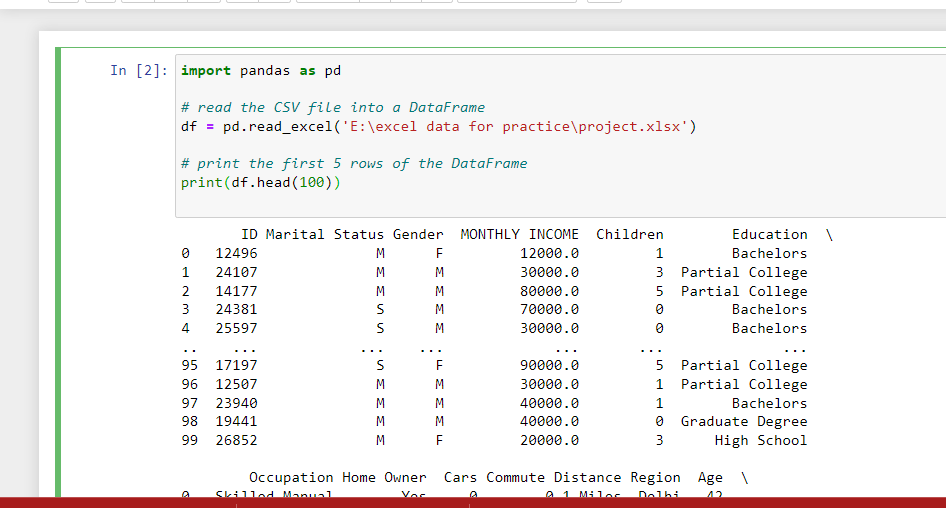
A common step in data cleaning with Python is importing data from
external files. With Pandas, you can easily load CSV and Excel files
into a DataFrame (df) for further analysis. This is where terms like
“csv to pandas” or “python import csv as dataframe” come in.
Answer: Use the read_csv() function to load CSV data
directly into a DataFrame.
import pandas as pd

# Load CSV into DataFrame
df = pd.read_csv("data.csv")

# Preview first 5 rows
print(df.head())
👉 This is the most common way for pandas load csv and import csv python pandas.
Answer: Use the read_excel() function to load Excel
sheets into Pandas.
# Load Excel file
df_excel = pd.read_excel("data.xlsx")

# Display first 5 rows
print(df_excel.head())
Answer: After importing, use
head() to preview rows and describe()
to get statistical summaries.
# Preview first 10 rows
print(df.head(10))

# Get data summary
print(df.describe())
📊 Now that you can load files into Pandas, let’s move to data cleaning methods such as handling missing values.
Next: Handling Missing Values →head() Method in Python
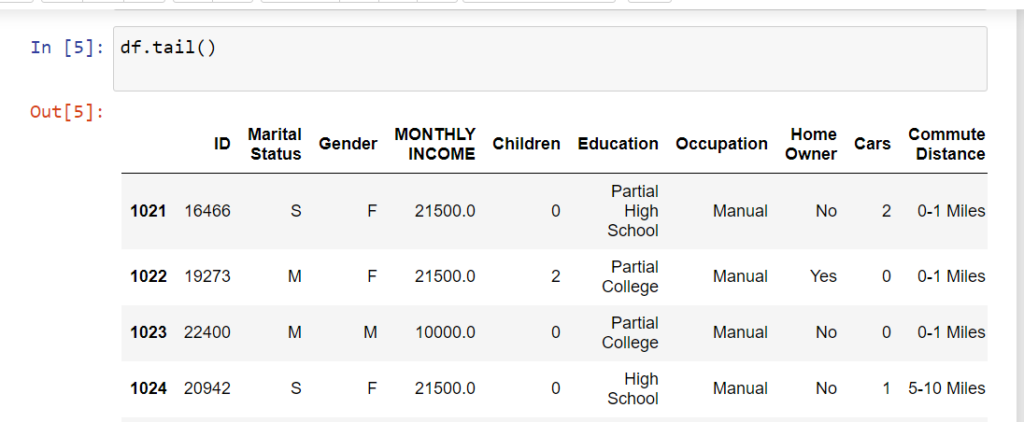
The head() function in Pandas is used to quickly preview the first few rows of a DataFrame (df).
Commonly searched as “pandas head method” or “what is df in Python”.
import pandas as pd

# Sample DataFrame
data = {'Name': ['Amit', 'Priya', 'Ravi', 'Sneha', 'Karan', 'Anjali'],
        'Age': [23, 25, 22, 24, 28, 21]}
df = pd.DataFrame(data)

# Display first 5 rows
print(df.head())

# Display first 3 rows
print(df.head(3))
   Name   Age
0  Amit   23
1  Priya  25
2  Ravi   22
3  Sneha  24
4  Karan  28
iloc – Integer Indexing
Use iloc to select rows and columns by integer index.
Popular queries: “df in Python”, “what is df in Python”, “pandas indexing”.
import pandas as pd

# Sample DataFrame
data = {'Name': ['Amit', 'Priya', 'Ravi', 'Sneha', 'Karan'],
        'Age': [23, 25, 22, 24, 28]}
df = pd.DataFrame(data)

# Select single row (first row)
print(df.iloc[0])

# Select multiple rows (first 3 rows)
print(df.iloc[0:3])

# Select specific cell (row 1, column 'Name')
print(df.iloc[1, 0])
Name    Amit
Age       23
Name: 0, dtype: object

    Name   Age
0   Amit   23
1  Priya   25
2   Ravi   22

Priya

sort_values() & sort_index())
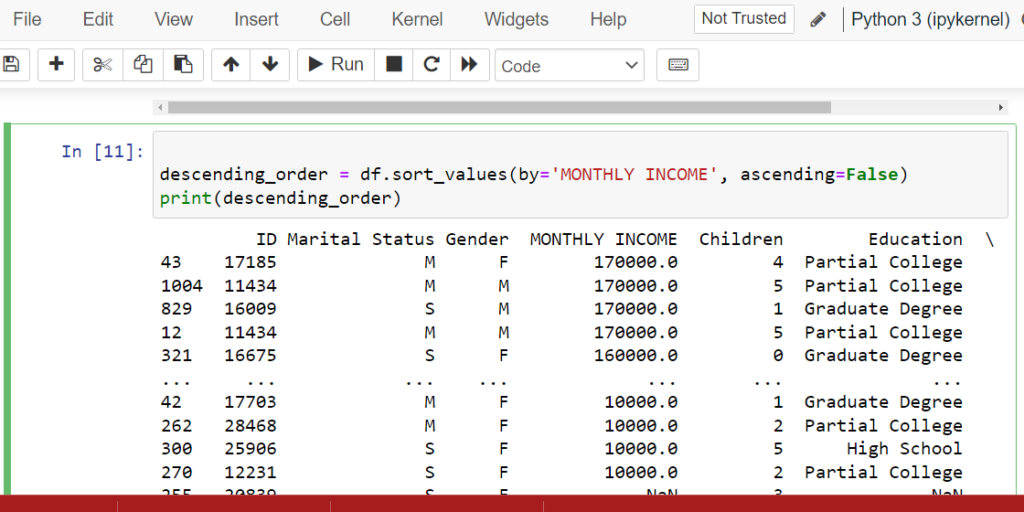
Use sort_values() to sort by column values and sort_index() to sort by index.
Common search queries: “jupyter ascending”, “pandas sort method”.
import pandas as pd

# Sample DataFrame
data = {'Name': ['Amit', 'Priya', 'Ravi', 'Sneha'],
        'Monthly Income': [50000, 70000, 45000, 60000]}
df = pd.DataFrame(data)

# Sort by index (descending)
print(df.sort_index(axis=0, ascending=False))

# Sort by column values (Monthly Income descending)
descending_order = df.sort_values(by='Monthly Income', ascending=False)
print(descending_order)
    Name   Monthly Income
3  Sneha           60000
2   Ravi           45000
1  Priya           70000
0   Amit           50000

    Name   Monthly Income
1  Priya           70000
3  Sneha           60000
0   Amit           50000
2   Ravi           45000
isnull() in Pandas
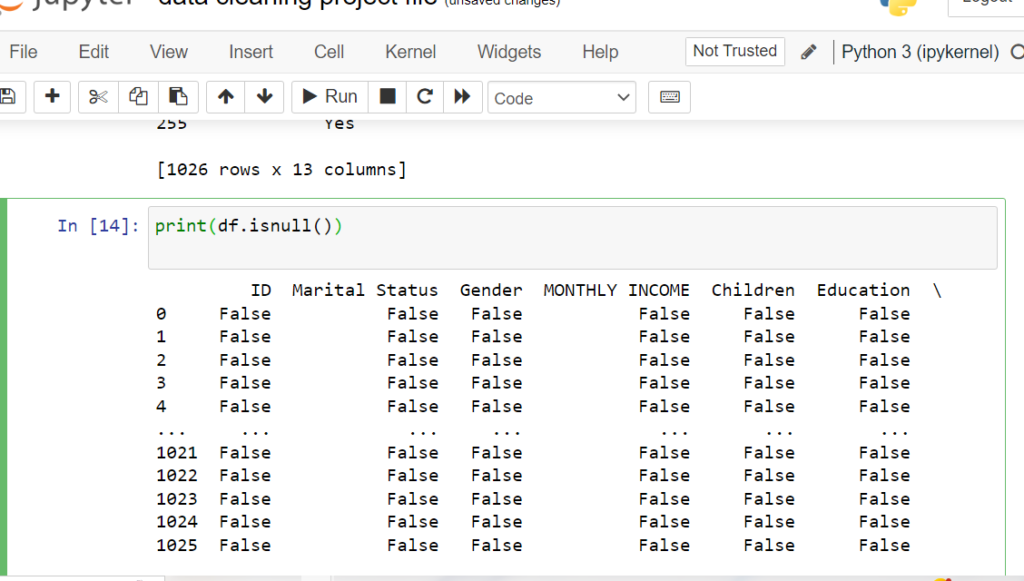
Use isnull() to check for missing values and isnull().sum()
to count them in each column.
GSC keywords covered: “isnull in python”, “pandas isnull function usage”, “isnull.sum in python”.
import pandas as pd

# Sample DataFrame with missing values
data = {'Name': ['Amit', 'Priya', 'Ravi', 'Sneha'],
        'Age': [25, None, 30, None]}
df = pd.DataFrame(data)

# Detect missing values (Boolean DataFrame)
print(df.isnull())

# Count missing values column-wise
print(df.isnull().sum())
    Name    Age
0  False  False
1  False   True
2  False  False
3  False   True

Name    0
Age     2
dtype: int64
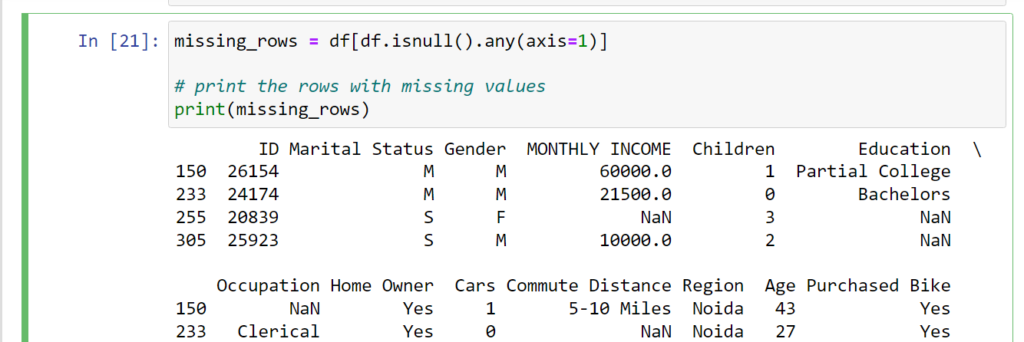
Use isnull() with any() and sum() to find missing values in columns,
and filter rows containing null values.
Keywords: “find columns with missing values pandas”, “python data cleansing”.
import pandas as pd

# Sample DataFrame
data = {'Name': ['Amit', 'Priya', 'Ravi', 'Sneha'],
        'Age': [25, None, 30, None],
        'City': ['Delhi', 'Mumbai', None, 'Pune']}
df = pd.DataFrame(data)

# Columns with missing values
print(df.isnull().any(axis=0))

# Count missing values per column
print(df.isnull().sum())

# Rows with missing values
missing_rows = df[df.isnull().any(axis=1)]
print(missing_rows)
Name    False
Age      True
City     True
dtype: bool

Name    0
Age     2
City    1
dtype: int64

    Name   Age    City
1  Priya   NaN  Mumbai
2   Ravi  30.0     NaN
3  Sneha   NaN    Pune
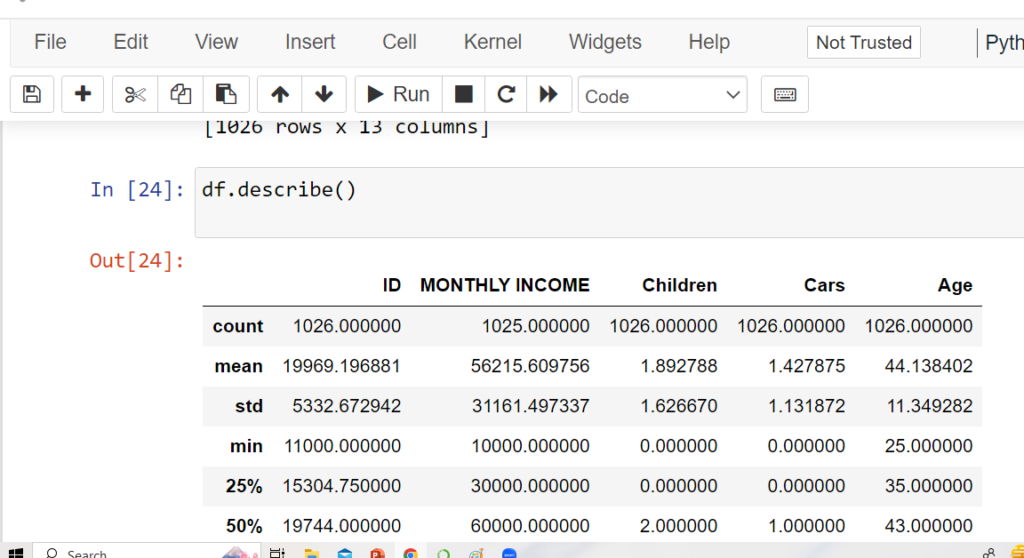
The describe() method summarizes numerical columns: count, mean, std, min,
25%, 50% (median), 75%, and max values.
Keywords: “pandas describe method”, “data cleaning python pandas”.
import pandas as pd

# Sample DataFrame
data = {'Age': [25, 30, 35, 40, 28],
        'Income': [40000, 50000, 60000, 75000, 48000]}
df = pd.DataFrame(data)

# Descriptive statistics
print(df.describe())
             Age        Income
count   5.000000      5.000000
mean   31.600000  54600.000000
std     6.429101  14031.787366
min    25.000000  40000.000000
25%    28.000000  48000.000000
50%    30.000000  50000.000000
75%    35.000000  60000.000000
max    40.000000  75000.000000
The info() method displays column names, data types, non-null counts,
and memory usage of a DataFrame.
Keywords: “df in python”, “what is df in python”, “python data cleansing”.
import pandas as pd

# Sample DataFrame
data = {'Name': ['Amit', 'Priya', 'Ravi'],
        'Age': [25, 30, None],
        'Country': ['India', 'USA', 'UK']}
df = pd.DataFrame(data)

# Get DataFrame info
df.info()
RangeIndex: 3 entries, 0 to 2
Data columns (total 3 columns):
 #   Column   Non-Null Count  Dtype
---  ------   --------------  -----
 0   Name     3 non-null      object
 1   Age      2 non-null      float64
 2   Country  3 non-null      object
dtypes: float64(1), object(2)
memory usage: 200.0+ bytes

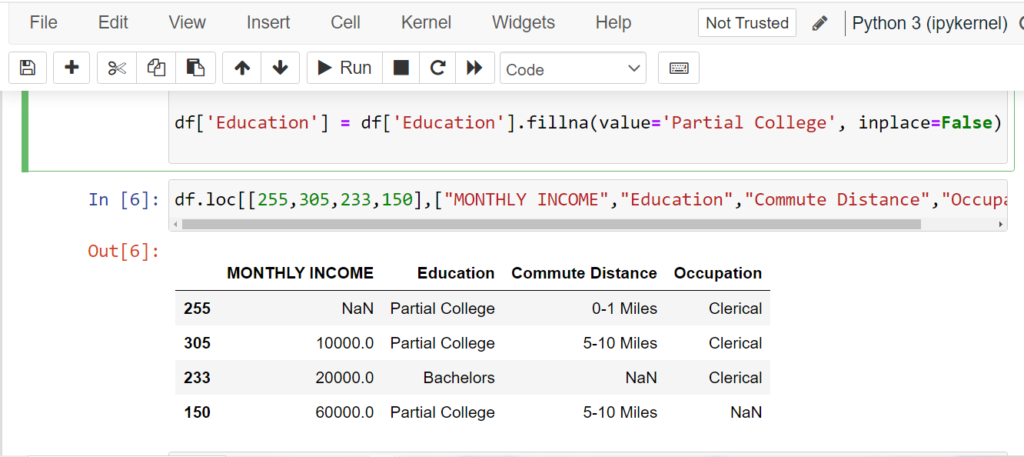
Use fillna() to replace NaN values in different ways: constant values,
forward/backward fill, interpolation, mean/median, or custom logic.
Keywords: “fill missing values with median pandas”, “python pandas data cleaning”.
# Fill missing values with constant
df.fillna(0)
# Fill with previous value
df.fillna(method='ffill')
# Fill with interpolated values
df.interpolate()
# Fill missing values with mean
df.fillna(value=df.mean())
# Fill missing values with median
df.fillna(value=df.median())
# Fill using custom function
def my_func():
    return 99
df.fillna(value=my_func())
# Fill specific column
df['Education'] = df['Education'].fillna(value='Partial College', inplace=False)
Use dropna() to remove rows or columns with missing values in a DataFrame.
Keywords: “pandas data cleaning methods”, “data cleaning python pandas”.
# Drop rows with any NaN values
df.dropna()
# Drop rows where all values are NaN
df.dropna(how='all')
# Drop columns with NaN values
df.dropna(axis=1)
# Keep rows with at least 2 non-NaN values
df.dropna(thresh=2)
# Drop rows where 'Age' is NaN
df.dropna(subset=['Age'])
The replace() method is used to substitute specific values in a DataFrame or Series.
Keywords: “pandas data cleaning methods”, “python data cleansing”.
# Replace value 0 with NaN
import numpy as np
df.replace(0, np.nan)
# Replace multiple values
df.replace(['?', 'NA', 'missing'], np.nan)
# Replace using column-specific mapping
df.replace({'Gender': {'M': 'Male', 'F': 'Female'}})
# Replace text patterns using regex
df.replace(to_replace=r'^Unknown.*', value='Other', regex=True)
# Replace 0 in 'Income' column with column median
df['Income'].replace(0, df['Income'].median(), inplace=True)
Use duplicated() to detect duplicate rows and drop_duplicates() to remove them.
Keywords: “pandas data cleaning methods”, “python pandas data cleaning”.
# Find duplicate rows
df.duplicated()
# Count duplicate rows
df.duplicated().sum()
# Drop duplicate rows
df.drop_duplicates()
# Drop duplicates based on 'Name' column
df.drop_duplicates(subset=['Name'])
# Keep last occurrence, drop others
df.drop_duplicates(keep='last')
The apply() method lets you apply a custom function (or lambda)
to each element, row, or column in a DataFrame.
Keywords: “python data cleansing”, “data cleaning python pandas”.
# Convert all names to lowercase
df['Name'] = df['Name'].apply(lambda x: x.lower())
# Remove leading/trailing spaces
df['City'] = df['City'].apply(lambda x: x.strip())
# Replace negative values with 0
df['Income'] = df['Income'].apply(lambda x: max(x, 0))
# Create full_name by combining two columns
df['Full_Name'] = df.apply(lambda row: row['First'] + ' ' + row['Last'], axis=1)
# Define a custom function
def clean_age(x):
    return 0 if pd.isnull(x) else int(x)

df['Age'] = df['Age'].apply(clean_age)
Data cleaning, also known as data cleansing or data scrubbing, is the process of identifying and correcting or removing errors and inconsistencies in datasets to improve data quality and ensure it is suitable for analysis
Common data cleaning tasks include handling missing values, removing duplicates, correcting data types, standardizing formats, dealing with outliers, and handling inconsistencies in data.
Imputation is the process of filling in missing values with estimated or calculated values. You can use Pandas functions like fillna() or libraries like Scikit-Learn’s SimpleImputer for imputation.
You can handle missing values using libraries like Pandas by using functions like dropna() to remove rows with missing values, fillna() to fill missing values with a specified value, or by using techniques like interpolation or imputation.
You can remove duplicate rows in a Pandas DataFrame using the drop_duplicates() method.
Outliers are data points that deviate significantly from the rest of the data. You can detect and handle outliers using techniques such as Z-score, IQR (Interquartile Range), or visualization methods. Libraries like Scikit-Learn and Matplotlib can be helpful.
