
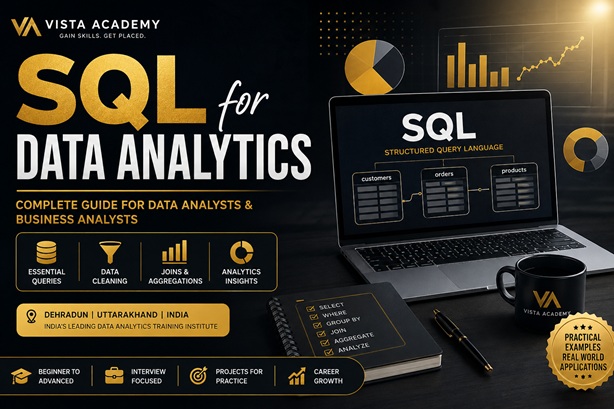
SQL for Data Analytics: Complete Guide with Examples
SQL for Data Analytics is one of the most practical skills for anyone who wants to work with business data, dashboards, reporting, customer information, sales records, finance data, operations data, or modern data platforms. This guide explains how SQL fits into the data analytics workflow, what a data analyst should learn first, how to clean and transform data, how to work with multiple tables, how advanced SQL supports analytical thinking, and how to turn SQL knowledge into portfolio-ready projects.
SQL → data cleaning → analysis → Power BI → business insights
SQL for Data Analytics: The Foundation Every Data Analyst Should Understand
SQL, or Structured Query Language, is the standard language used to work with many relational databases. In a data analytics environment, SQL is not simply a programming language to memorize. It is a practical way of asking precise questions of data. An analyst may need to know which products generated the highest revenue, which customers have become inactive, which region is growing fastest, how monthly sales changed, which orders were delayed, or where a business is losing conversions. SQL helps answer these questions by allowing the analyst to retrieve and transform the relevant records.
When people search for SQL for data analytics, they are usually looking for more than SELECT statements. They want to understand how SQL is used in real analytical work. A useful learning path therefore begins with the fundamentals and gradually moves into filtering, sorting, grouping, joins, conditional logic, date analysis, string cleaning, subqueries, common table expressions, window functions and analytical problem solving.
The most important shift for a beginner is to stop thinking of SQL as a collection of isolated commands. A data analyst combines SQL concepts to answer a business question. SELECT chooses what information is needed. WHERE narrows the records. JOIN brings related information together. GROUP BY creates meaningful summaries. Aggregate functions calculate totals and averages. Window functions compare rows without losing the detail of the underlying records. Each concept becomes more valuable when it is used as part of a complete analytical workflow.
SQL is especially useful because business data often lives in several connected tables rather than one clean spreadsheet. A customer table may contain customer details, an orders table may contain transactions, a products table may contain product attributes, and a payments table may contain payment information. A strong analyst must be able to understand those relationships and combine them correctly.
How SQL Fits into a Real Data Analytics Workflow
A practical data analytics workflow normally begins with a question rather than a query. Suppose a business wants to understand why revenue declined in a particular region. The analyst first defines the metric, identifies the relevant data sources, checks the quality of the records, retrieves the required data, performs calculations, investigates patterns and communicates the result through a report or dashboard.
SQL can support several stages of this process. It can help locate the records, identify duplicates, inspect missing values, standardize text, calculate metrics, combine datasets and create a clean analytical result. The output may then be connected to a business intelligence platform such as Power BI. This is why SQL is often considered one of the core skills in the broader data analytics stack.
SQL also improves analytical discipline. When an analyst writes a query, every filter and calculation has to be explicit. That makes the logic easier to inspect, test and reproduce. A well-designed query can be rerun when new data arrives, which is much more scalable than manually copying values between spreadsheets.
SQL for Data Analysis vs SQL for Data Analytics
The phrases SQL for data analysis and SQL for data analytics are often used interchangeably. In practical work, both refer to using SQL to investigate data and generate useful information. Data analysis can describe the detailed examination of a dataset, while analytics often emphasizes using data to support decisions, performance measurement and business questions.
For a learner, the distinction is less important than building the right skills. You should be comfortable reading tables, understanding relationships, writing filters, creating summaries, joining datasets and interpreting results. The goal is not to become someone who can merely write a query; the goal is to become someone who can use SQL to answer a meaningful question accurately.
Important: SQL syntax varies slightly between MySQL, PostgreSQL, SQL Server, Oracle and other database systems. Learn the analytical concepts first, then understand the syntax used by the database platform you work with.
Essential SQL Skills for Data Analysts: Cleaning, Filtering, Aggregation and Joins
Strong SQL for data analysts starts with a small set of concepts that appear repeatedly in real projects. Beginners sometimes rush toward advanced queries without becoming comfortable with basic filtering and aggregation. That creates avoidable mistakes later. A better approach is to become fluent with simple analytical operations and then combine them.
Filtering Data with WHERE
Filtering is one of the most common tasks in data analysis SQL. A database can contain millions of records, but a business question may concern only one region, one product category, a specific time period, active customers, or transactions above a particular value. The WHERE condition narrows the dataset before further analysis.
For example, an analyst investigating high-value transactions may filter orders above a chosen revenue threshold. Another analyst may isolate customers from a particular city. Filtering is also essential when validating data because it allows an analyst to inspect unusual or suspicious records separately.
Sorting Results with ORDER BY
Sorting helps analysts understand rankings. Revenue can be ordered from highest to lowest, customers can be ranked by purchase value, and products can be sorted by units sold. ORDER BY is simple, but it becomes powerful when combined with calculated metrics and aggregation.
GROUP BY and Aggregate Functions
GROUP BY is central to SQL analytics because businesses rarely care about every individual transaction. They often need summaries. An analyst might calculate total sales by region, average order value by customer segment, number of orders by month, or total units sold by product.
Common aggregate functions include SUM, COUNT, AVG, MIN and MAX. The analytical skill is not simply knowing these functions; it is knowing which metric answers the business question and what level of aggregation is appropriate.
For example, average revenue per customer and average revenue per order are different metrics. A careless query can produce a technically valid result that answers the wrong question. Good SQL analysis therefore begins with metric definitions.
HAVING for Aggregated Results
WHERE filters individual records before grouping, while HAVING is commonly used to filter grouped results after aggregation. This distinction matters when the question is something like: Which customers have placed more than a certain number of orders? Which regions generated revenue above a target? Which products have sold more than a specified number of units?
JOINs: The Backbone of SQL Data Analysis
Real-world analytics rarely stays inside a single table. JOINs allow analysts to combine related information. An INNER JOIN returns matching records between related datasets. A LEFT JOIN keeps all records from the left table while bringing matching information from the right table. Other join types have their own uses and should be understood according to the data relationship and analytical objective.
Understanding joins requires more than memorizing definitions. You need to know the grain of each table, identify the key fields, and anticipate what happens when a key appears multiple times. If a customer table contains one row per customer and an orders table contains many rows per customer, joining them creates multiple rows for customers with multiple orders. That can be correct for transaction analysis but dangerous when calculating customer-level totals without appropriate aggregation.
This concept of data grain is one of the most important ideas for a data analyst. Before joining two tables, ask: what does one row represent in each table? Once that is clear, the correct join and aggregation strategy becomes much easier to design.
String Cleaning in SQL
Data cleaning is a major part of data analysis. Names may contain extra spaces, categories may use inconsistent capitalization, and imported data may contain unwanted characters. SQL functions such as TRIM, REPLACE, LOWER, UPPER and SUBSTRING can help standardize text.
TRIM is useful for removing unnecessary spaces. LOWER and UPPER can standardize capitalization. REPLACE can substitute unwanted characters or phrases. SUBSTRING can extract a portion of a text field. These operations are especially useful when values that look similar to a human are technically different to a database.
For example, a category stored as “Data Analytics”, “data analytics” and “ Data Analytics ” may represent the same concept but behave differently during grouping or filtering. Standardization before aggregation can prevent misleading results.
SQL Queries for Data Analytics: Practical Business Questions and Examples
The best way to learn SQL for analytics is to connect every concept to a business question. A query is useful when it helps someone understand performance, customers, products, costs, operations or opportunities. The following examples describe common analytical patterns without turning the article into a code-heavy reference.
1. Sales Performance Analysis
Imagine a company wants to know which regions are producing the most revenue. The analyst would group sales by region and calculate the appropriate revenue measure. The result can be ranked from highest to lowest so decision-makers can compare performance.
This type of analysis can be extended to monthly trends, product categories, sales representatives, customer segments and channels. The key is to define the business metric first and then select the correct fields and level of aggregation.
2. Customer Analysis
Customer analytics is one of the strongest use cases for SQL. An analyst may calculate the number of orders per customer, total customer revenue, average order value, recency of purchase or purchase frequency. These measures can support segmentation and retention analysis.
SQL can also help identify customers who have not purchased recently, customers whose spending is increasing, or customers who contribute a disproportionately large share of revenue. Such analysis can become the foundation for customer lifecycle strategies.
3. Monthly and Time-Based Analysis
Time is central to business analytics. Revenue today means little without comparison to previous periods. SQL can group records by day, week, month, quarter or year depending on the business question. Analysts can then compare current performance with historical periods.
Time-based analysis can reveal seasonality, growth, declining performance and unusual spikes. It is also useful when preparing datasets for dashboards, because Power BI and other visualization tools need well-structured time-related fields to produce reliable trends.
4. Product and Inventory Analysis
Product analytics can identify best-selling products, low-performing categories, stock movement and reorder requirements. When sales data is connected with product and inventory tables, SQL can provide a foundation for operational decisions.
An analyst might investigate products with high sales but low remaining inventory, products with declining demand, or categories with strong revenue but weak margins. SQL becomes especially valuable when the data is too large or too frequently updated for manual spreadsheet work.
5. Marketing and Conversion Analysis
Marketing teams often need to compare campaigns, channels, audiences and conversion outcomes. SQL can combine campaign information with customer actions and transaction records to calculate performance metrics. Analysts can investigate how many users entered a funnel, how many completed a desired action, and where drop-offs occurred.
The important lesson is that SQL does not automatically create a good marketing metric. The analyst must understand the business definition of a conversion, choose the correct population, avoid duplicate counting and make sure the time period is consistent.
6. Data Quality Analysis
SQL can also be used to analyze the data itself. Analysts can search for missing values, duplicate identifiers, invalid categories, unexpected dates, negative quantities and unusual numerical values. Data-quality queries should be part of a repeatable workflow rather than an afterthought.
Good data analysis includes knowing when not to trust the result. A polished dashboard can still be wrong if the underlying dataset contains duplicate records or inconsistent definitions. SQL gives analysts a practical way to investigate these problems.
Advanced SQL for Data Analytics: Window Functions, CTEs and Analytical Thinking
Once the fundamentals are comfortable, advanced SQL helps analysts solve more complex questions without moving immediately into separate programming environments. Advanced SQL is particularly useful for rankings, running totals, period comparisons, customer behavior, cohort-style analysis and multi-step transformations.
Window Functions
Window functions allow calculations across related rows while preserving the detail of individual records. This is extremely useful for analytical work because you can compare a row with other rows without collapsing the dataset into one row per group.
Common analytical patterns include ranking products, calculating running totals, finding the previous or next record, calculating moving averages and comparing an individual’s value with a group-level measure. Functions such as ROW_NUMBER, RANK, DENSE_RANK, LAG and LEAD are valuable additions to a data analyst’s toolkit.
Consider a customer purchase history. A normal GROUP BY can calculate total spending per customer, but it removes transaction-level detail. A window function can calculate a running customer total while keeping each transaction visible. That makes window functions particularly powerful for behavioral analysis.
Common Table Expressions
Common Table Expressions, often called CTEs, allow a complex query to be organized into logical steps. Instead of writing one extremely long statement, an analyst can create a temporary named result and use it in a later step.
CTEs are valuable for readability and debugging. They can also make analytical logic easier for another analyst to review. A good query should not only produce the right result; it should make the reasoning understandable.
Subqueries and Multi-Step Analysis
Subqueries can be useful when one analytical result needs to be compared with another. For example, an analyst may want to identify customers whose spending is above the overall average. Another common pattern is to find products whose performance exceeds the average for their category.
As queries become more complex, readability becomes a professional skill. Clear aliases, meaningful naming, logical formatting and comments where appropriate can make analytical SQL easier to maintain.
Conditional Logic with CASE
CASE expressions allow analysts to create categories based on business rules. A customer can be classified into spending bands, an order can be categorized by size, or a transaction can be labeled as on-time or delayed. Conditional logic is often the bridge between raw data and a business-friendly analytical dataset.
For example, a business may define customers as high, medium or low value according to spending thresholds. SQL can create that classification so it can be reused in summaries, reports and dashboards. The important practice is to document the thresholds and ensure they reflect the actual business definition.
SQL for Trend and Forecasting Preparation
SQL can prepare data for forecasting by creating time-based summaries, calculating historical metrics and producing features that can later be used by statistical or machine-learning workflows. SQL itself is not a replacement for every forecasting method, but it is often an important preparation layer.
Moving averages, period-over-period comparisons and historical aggregates can help analysts understand trends. More advanced predictive workflows may combine SQL with Python, machine-learning systems or specialized analytics platforms.
SQL Projects for Data Analysts: Build a Portfolio That Demonstrates Real Skills
Knowing SQL syntax is useful, but employers and clients also want evidence that you can apply it. SQL projects provide that evidence. A strong project should begin with a clear business problem, identify the data, explain the cleaning process, define the metrics, show the analytical approach and communicate the final insights.
Do not build a portfolio by collecting dozens of tiny exercises. A smaller number of well-explained projects can demonstrate much more professional ability. Each project should show how you moved from a question to a defensible answer.
Project 1: Sales Analytics
Build a sales analysis that examines revenue by region, product and month. Add customer-level analysis and identify top-performing categories. The project can demonstrate filtering, aggregation, joins, date analysis and ranking.
To make the project stronger, explain the business implications. Which region deserves attention? Are high revenues concentrated in a small number of products? Is growth consistent throughout the year? What additional data would be required to understand profitability?
Project 2: Customer Segmentation
Create customer groups using purchase frequency, total spending and recency. SQL can calculate the base measures, while a business rule can translate them into useful segments. This project demonstrates that the analyst understands both technical queries and business interpretation.
Project 3: Student Performance Analytics
A student dataset can be used to examine scores, attendance, subject-level performance and improvement over time. Ranking functions can identify high performers, while conditional logic can categorize performance bands. This is a useful educational project because the business questions are easy to explain.
Project 4: Inventory and Operations Analysis
Analyze stock levels, product movement and reorder signals. Join product records with sales or order data and investigate which products move quickly, which remain inactive and which may require operational attention.
Project 5: Marketing Funnel Analysis
Build a funnel from campaign exposure to website activity and conversion. The project should clearly define each stage and avoid double counting users. This demonstrates analytical thinking around event data and business metrics.
What Makes a SQL Portfolio Project Job-Ready?
A job-ready project should answer a realistic question and show your reasoning. Include a short business context, data description, data-quality checks, key metrics, analytical steps and final recommendations. If you use Power BI for visualization, explain how the SQL output feeds the dashboard.
Recruiters and hiring managers can learn more from a project that says “revenue fell 8% in this segment and the decline was concentrated in these months” than from a repository containing only screenshots of queries. Your ability to communicate the meaning of the analysis matters.
SQL, Power BI and DAX: How the Skills Work Together in Data Analytics
SQL and Power BI are often discussed together because they solve different parts of the analytics workflow. SQL is commonly used to retrieve, clean, transform and prepare data from databases. Power BI is commonly used to model, visualize and communicate that data through interactive reports and dashboards.
DAX, or Data Analysis Expressions, is used inside Power BI and related Microsoft analytical tools for calculations and analytical expressions. If you are already learning SQL for data analytics, understanding where DAX fits can help you build a more complete skill set.
A simple way to think about the workflow is: SQL helps you work with the source data, data modeling creates useful relationships and structures, DAX supports analytical calculations in the BI model, and visualization communicates the result. The exact architecture differs between organizations, but the principle is useful for beginners.
After learning SQL, explore the Power BI Data Modeling Guide with Examples & 50+ DAX Formulas to understand how SQL data can become a structured analytical model and interactive report.
Why Data Modeling Matters
Data modeling determines how tables relate to each other and how analytical questions can be answered consistently. A well-designed model can reduce confusion, improve reporting performance and make calculations easier to maintain. Poor modeling can lead to ambiguous relationships, duplicate counting and measures that appear correct in one visual but fail in another.
Why SQL and DAX Should Not Be Treated as Competitors
Beginners sometimes ask whether they should learn SQL or DAX. In many analytics roles, the better answer is that they serve different purposes. SQL is fundamental for working with relational data and data preparation. DAX is important when building calculations in a Power BI semantic model. Learning both can make an analyst more versatile.
A Practical Learning Sequence
A sensible sequence for many beginners is SQL fundamentals first, followed by data cleaning and analytical SQL, then data modeling and Power BI, followed by DAX and dashboard design. Statistics, Python and AI-enhanced analytics can then be added according to career goals.
This sequence is not a rigid rule. Some learners may encounter Power BI first, while others may start with spreadsheets. What matters is understanding how the skills connect instead of learning each tool in isolation.
How to Learn SQL for Data Analytics: A Practical Roadmap
If you are starting from zero, do not try to memorize every SQL function. Build your knowledge in layers. First understand tables, rows, columns, primary keys and relationships. Then learn basic retrieval and filtering. After that, move into aggregation and joins. Once those concepts are comfortable, add data cleaning, date functions, conditional logic, subqueries, CTEs and window functions.
Stage 1: Understand Relational Data
Learn what tables represent, how rows and columns work, why primary keys matter and how foreign keys connect tables. Understanding relationships makes joins much easier later.
Stage 2: Master the Core Query Patterns
Practice SELECT, WHERE, ORDER BY, GROUP BY, HAVING and aggregate functions until you can use them without hesitation. Do not focus only on syntax. For each exercise, write down the business question first.
Stage 3: Become Comfortable with JOINs
Practice INNER JOIN and LEFT JOIN using realistic tables. Pay special attention to one-to-many relationships and duplicate rows. Check totals before and after joins so you can detect unexpected changes.
Stage 4: Learn Data Cleaning
Work with messy text, missing values, inconsistent categories and invalid records. Learn how to standardize fields and document the decisions you make.
Stage 5: Move to Advanced SQL
Add CASE expressions, subqueries, CTEs and window functions. Focus on analytical patterns such as rankings, running totals, period comparisons and customer behavior.
Stage 6: Build Real Projects
Choose datasets that resemble real business environments. Build a project from question to recommendation. Publish your findings in a clear format and explain your assumptions.
Stage 7: Connect SQL with Power BI and AI-Enhanced Analytics
Once SQL becomes comfortable, learn how analytical outputs feed dashboards and models. Power BI can help communicate results, while modern AI-assisted workflows can accelerate exploration, documentation and insight generation. AI should support analytical judgment rather than replace validation.
Common SQL Mistakes Data Analysts Should Avoid
Learning SQL is not only about producing a result that looks reasonable. An analyst must also know whether the result is correct. One of the most common mistakes is selecting the wrong level of detail. If a table contains one row per order but the analyst needs one row per customer, simply joining another table and summing values can produce duplicated totals. Always identify the grain of the data before calculating a metric.
Another common problem is using an INNER JOIN when a LEFT JOIN was required. Suppose the objective is to list every customer and show their order activity. An INNER JOIN may remove customers who have no orders. A LEFT JOIN can preserve the customer population and make inactive customers visible. The correct join depends on the business question, not on which join happens to be familiar.
Analysts should also be careful with NULL values. A missing value does not always mean zero, and replacing every NULL with zero can change the meaning of the data. Before handling missing values, understand what the field represents and why the value is absent.
Date filtering is another frequent source of errors. Analysts should understand whether timestamps include time zones, whether the end date is inclusive, and whether the selected period matches the business definition of a month or reporting period. Small date mistakes can materially change a KPI.
Finally, avoid building unnecessarily complicated queries when a simpler structure is easier to validate. Advanced SQL is valuable, but complexity should solve a real analytical problem. Readability, testing and maintainability are professional skills.
How to Validate a SQL Analysis Before Sharing It
Validation is one of the most important habits for anyone learning SQL for data analytics. Start by checking the total number of records before and after major transformations. If a join suddenly multiplies the number of rows, investigate why. The increase may be expected, or it may indicate a many-to-many relationship that will distort calculations.
Check known totals whenever possible. If the business reports total monthly revenue through an established system, compare your SQL result with that figure and investigate differences. Reconcile a sample of individual records manually. A small manual check can reveal an incorrect join key, filter or calculation.
Use reasonableness checks as well. If an average order value suddenly becomes ten times larger than normal, do not assume the business has changed overnight. Look at the query logic, duplicates and data quality first. Analytical judgment means questioning surprising results instead of automatically presenting them.
Validation should also include edge cases. Test records with missing values, unusual dates, zero quantities, negative amounts, duplicate identifiers and customers with no transactions. A query that works only on clean examples is not ready for production-style analysis.
SQL for Business Analysts and Reporting Teams
SQL is not limited to people with a formal “Data Analyst” job title. Business analysts, reporting analysts, operations analysts, marketing analysts, finance analysts and product analysts may all use SQL. The exact questions differ, but the underlying workflow remains similar: identify the right records, transform them into useful information and communicate the result.
For a business analyst, SQL can help answer questions about performance against targets, customer activity, operational efficiency and process bottlenecks. For a marketing analyst, it can connect campaigns with customer actions. For a finance analyst, it can support transaction analysis and reporting. For an operations analyst, it can help identify delays, inventory issues and service-level trends.
This is why the phrase SQL for business analyst is also closely related to SQL for data analytics. The tool remains the same; the business questions change.
SQL in Modern Data Analytics Teams
Modern analytics teams may work with traditional relational databases, cloud data warehouses, operational systems, APIs, spreadsheets and business intelligence platforms. SQL remains relevant because many of these environments provide SQL interfaces for querying structured data.
An analyst may receive a request from a manager, explore data in a warehouse, create a clean dataset, publish a Power BI report and then maintain the underlying query as new records arrive. In a mature team, SQL can become part of a repeatable pipeline rather than a one-time analysis.
Modern analytics also increasingly involves AI-assisted workflows. AI can help explain unfamiliar SQL, generate draft queries, suggest analytical approaches or accelerate documentation. However, the analyst remains responsible for verifying the logic, understanding the data and validating the result. AI-generated SQL should never be trusted simply because it executes successfully.
How SQL Helps with Data Storytelling
Data storytelling starts before the chart is created. SQL can help uncover the evidence behind a story. Suppose sales declined. SQL can break the decline down by region, product, channel and customer segment. The analyst can then determine whether the decline is broad or concentrated.
A useful story generally contains context, evidence, explanation and action. SQL provides the evidence layer. Visualization tools can make the evidence easier to see, while communication skills explain why the finding matters.
For example, “sales decreased” is a weak insight. “Overall sales decreased, with most of the decline concentrated in one product category and two regions” is more informative. The next step is to investigate possible causes and identify what decision the business could make.
How Much SQL Does a Beginner Really Need?
A beginner does not need to know every database feature before applying for an entry-level analytics role. A strong foundation in core query patterns is more useful than memorizing hundreds of functions. You should be able to read a schema, filter records, aggregate data, join related tables, handle common cleaning tasks and explain your result.
After that foundation, advanced SQL can differentiate your work. Window functions, CTEs, conditional logic, date analysis and performance awareness become increasingly valuable as projects become more complex.
The best learning strategy is progressive practice. Learn one concept, apply it to several business questions, make a mistake, inspect the result and then improve the query. Repetition with meaningful datasets is much more effective than memorizing syntax without context.
SQL Interview Preparation for Data Analyst Roles
SQL interviews often test both syntax and reasoning. A candidate may be asked to find duplicate records, calculate a total by category, identify the second-highest value, compare current and previous periods, find customers with no orders, or calculate a ranking.
Interview preparation should therefore include patterns rather than isolated answers. Practice joins, aggregation, subqueries, CTEs and window functions. More importantly, explain why you selected a particular approach. Interviewers may change the dataset or add a condition, and understanding the reasoning allows you to adapt.
When solving an interview problem, first clarify the expected output and the grain of the result. Then identify the relevant tables and keys. Build the simplest correct solution, validate it with edge cases and only then optimize or simplify it.
Building a SQL Learning Routine
A short, consistent practice routine can be more effective than occasional long study sessions. Spend one session understanding a concept, another solving exercises and another applying the concept to a project. Keep a personal reference of mistakes you repeatedly make.
When you solve a problem, write down the business question in plain language before writing SQL. Then describe the expected output. This habit trains you to think like an analyst instead of simply reacting to syntax.
Review old queries after a few days. Ask whether the aliases are understandable, whether filters are necessary, whether the join logic is safe and whether another analyst could maintain the query. This develops professional SQL style.
SQL Learning in Dehradun and Uttarakhand
For learners in Dehradun and Uttarakhand, SQL can be a practical starting point for building a broader data analytics skill set. A local learning environment can provide structured practice, project guidance and a clear path from fundamentals to job-oriented analytics.
Vista Academy’s data analytics learning path is designed around modern analytics skills, including SQL and related tools. Learners who want a broader program can explore the AI-Enhanced Data Analytics & Data Science Course in Dehradun. The course page provides the appropriate program details, while this article can be used as a SQL learning reference.
If your goal is to work with Power BI as well, continue to the Power BI Data Modeling Guide with Examples & 50+ DAX Formulas. Learning how SQL data moves into a model and then becomes a business dashboard can give you a more complete understanding of the analytics workflow.
SQL Career Paths You Can Explore
SQL can support several career directions. Data analysts use it for investigation and reporting. Business analysts use it to answer operational and commercial questions. BI analysts combine SQL with reporting platforms. Analytics engineers may work more deeply with transformation, data models and warehouse workflows. Data scientists may use SQL to retrieve and prepare data before statistical or machine-learning work.
The right path depends on your interests. If you enjoy business questions and dashboards, data analytics and BI may be a natural direction. If you enjoy data pipelines and modeling, analytics engineering may be attractive. If you enjoy statistics and predictive modeling, SQL can form part of a broader data science stack.
In all of these paths, the fundamental skill is similar: understand data well enough to transform it accurately and use it to answer meaningful questions.
What Employers Look for Beyond SQL Syntax
Employers often care about the quality of your analytical thinking as much as the number of SQL functions you know. A candidate who can write a complicated query but cannot explain the metric may struggle in a real analytics environment. A candidate who can define the question, understand the data structure, validate assumptions and communicate the result can create value even when the query itself is relatively simple.
Business context matters. If a manager asks why customers are leaving, the first task is not to write a query. It is to clarify what “leaving” means. Does it mean no purchase in 30 days, 60 days or 90 days? Are new customers included? Should cancelled orders count? Once the definition is clear, SQL can be used to build the evidence.
Employers also value reliability. A professional analyst knows how to document assumptions, check results and identify limitations. If the available data cannot prove a conclusion, the analyst should say so. This level of honesty makes analytical work more useful for decision-makers.
From SQL Practice to Professional Analytics
The transition from learning exercises to professional analytics happens when you begin thinking in terms of decisions. Instead of asking only “Can I write this query?”, ask “What decision could this result support?” That question naturally leads to better metrics, clearer visualizations and stronger recommendations.
Suppose a query identifies the top ten products by revenue. The next analytical question might be whether those products are also profitable, whether their sales are growing, whether inventory is sufficient, and whether the revenue is concentrated among a small group of customers. One SQL result can therefore lead to several deeper questions.
This curiosity is an important part of becoming a data analyst. SQL gives you the technical ability to investigate, but analytical judgment determines what is worth investigating.
A Practical Checklist for Becoming Job-Ready in SQL
Keep your portfolio focused on clarity. A hiring manager should be able to understand the question, dataset, approach and conclusion without reading every line of your query. This is especially important when you combine SQL with Power BI, because the final dashboard should tell the same story as the underlying analysis.
As you progress, revisit your early projects and improve them. Add better validation, clearer metrics, stronger explanations and more useful visualizations. This demonstrates growth and turns practice work into a professional body of evidence.
That improvement cycle is what turns SQL knowledge into practical analytics capability: learn, practice, validate, explain, improve and apply the skill to increasingly realistic business problems.
Frequently Asked Questions About SQL for Data Analytics
What is SQL for data analytics?
Is SQL important for a data analyst?
What SQL should a data analyst learn first?
Which SQL functions help clean string variables?
What is the difference between WHERE and HAVING?
Why are JOINs important in SQL analytics?
Are window functions important for data analysts?
Should I learn SQL before Power BI?
What is DAX in Power BI?
Can SQL be used for predictive analytics?
How can I become job-ready in SQL for data analytics?
Where can I learn data analytics in Dehradun?
Keep practicing with real datasets and measurable business questions every week.