
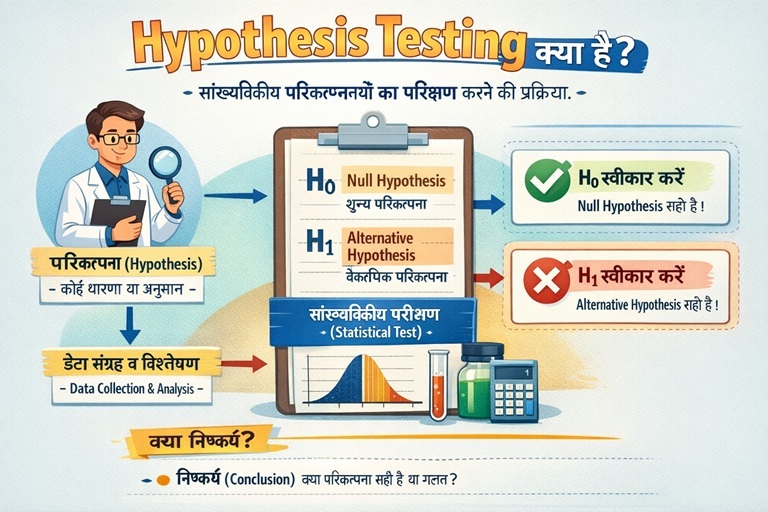
Hypothesis Testing क्या है? (परिकल्पना परीक्षण)
Table of Contents
ToggleStatistics & Data Analytics का सबसे ज़रूरी concept
आज के समय में हम हर दिन decisions लेते हैं — business में, studies में, marketing में, policy में और यहाँ तक कि personal life में भी। लेकिन सवाल यह है: क्या हमारे decisions सच में data पर based होते हैं, या सिर्फ अंदाज़े (assumptions) पर?
Hypothesis Testing एक statistical method है जिसकी मदद से हम किसी भी assumption या claim को data के ज़रिये scientifically test करते हैं। आसान शब्दों में:
Simple Definition
Hypothesis Testing का मतलब है — data का use करके यह verify करना कि कोई statement सही है या नहीं।
बहुत बार organizations, companies या individuals कुछ claims करते हैं जैसे:
Education
“नई teaching method से students के marks बढ़ गए।”
Business
“Discount देने से sales improve हुई है।”
Marketing
“New ad campaign ज़्यादा customers ला रही है।”
अब सवाल ये नहीं है कि ये statements अच्छे लगते हैं या नहीं, सवाल ये है: क्या data भी यही कहता है?
यही काम Hypothesis Testing करती है। यह हमें emotions, bias और guesswork से बाहर निकालकर data-driven decision making की तरफ ले जाती है।
Statistics, Data Analytics, Data Science, Machine Learning — इन सभी fields की foundation में Hypothesis Testing छुपी हुई है। अगर आप data analyst या data scientist बनना चाहते हैं, तो यह concept optional नहीं, mandatory skill है।
Hypothesis Testing हमें यह सिखाती है कि “जो हमें दिख रहा है, क्या वह सच में statistically correct भी है?” या फिर वो सिर्फ coincidence है।
Hypothesis testing helps us separate assumptions from facts, and opinions from evidence — using data.
Hypothesis का Meaning क्या होता है?
Assumption vs Reality — data के साथ समझिए
Hypothesis शब्द सुनते ही ज़्यादातर students को लगता है कि यह कोई बहुत heavy statistical term है, लेकिन सच यह है कि हम daily life में hypothesis रोज़ बनाते हैं — बस हमें उसका नाम नहीं पता होता।
Hypothesis का simple meaning है — कोई भी ऐसा assumption या statement जिसे हम सच मान लेते हैं, लेकिन अभी तक data से prove नहीं किया गया है।
Easy Definition
Hypothesis = एक educated guess Testing = data से उसे verify करना
मान लीजिए आप कहते हैं: “इस महीने sales कम इसलिए हुई क्योंकि price ज़्यादा थी।” यह एक hypothesis है — क्योंकि यह अभी सिर्फ एक belief है, proof नहीं।
Hypothesis Testing का काम यही है: belief को data से test करना। हो सकता है sales price की वजह से नहीं, बल्कि demand, competition या season की वजह से कम हुई हो।
Personal Life
“अगर मैं रोज़ 2 घंटे पढ़ूँगा, तो मेरा exam clear हो जाएगा।”
Business
“New offer launch करने से revenue बढ़ेगा।”
Education
“Online classes offline से ज़्यादा effective हैं।”
ये सभी statements सुनने में logical लगती हैं, लेकिन data analytics में logic से ज़्यादा evidence important होता है।
Hypothesis Testing हमें emotions और opinions से बाहर निकालकर facts और numbers पर decision लेना सिखाती है। यही reason है कि modern companies, governments और researchers बिना hypothesis testing के कोई major decision नहीं लेते।
Hypothesis Testing का core idea यही है — “जो हम सोच रहे हैं, क्या data भी वही सोच रहा है?”
A hypothesis is not the truth. It is only a statement waiting to be tested by data.
Hypothesis Testing क्यों ज़रूरी है?
Guessing से निकलकर data-driven decisions तक
आज के digital और analytics-driven world में सबसे बड़ी problem यह नहीं है कि हमारे पास data नहीं है, problem यह है कि हम data से सही decision नहीं ले पाते।
बिना Hypothesis Testing के decisions ज़्यादातर experience, intuition या gut feeling पर लिए जाते हैं। कई बार यह काम कर जाता है, लेकिन ज़्यादातर cases में यही approach गलत conclusions और business losses की वजह बनती है।
Without Hypothesis Testing
“मुझे लगता है ऐसा हुआ होगा।” “शायद यही reason है।” “पिछली बार तो काम किया था।”
With Hypothesis Testing
“Data क्या कह रहा है?” “Is difference statistically significant?” “क्या ये result coincidence हो सकता है?”
Hypothesis Testing हमें यह power देती है कि हम random variation और real impact के बीच फर्क कर सकें। हर change meaningful नहीं होता — कुछ changes सिर्फ chance की वजह से भी हो सकते हैं।
उदाहरण के लिए, अगर किसी महीने sales 5% बढ़ गई, तो यह जरूरी नहीं कि strategy काम कर गई हो। Hypothesis Testing check करती है कि यह increase statistically valid है या नहीं।
Key Insight
Hypothesis Testing का main goal यह नहीं है कि हम change को दिखाएँ, बल्कि यह prove करना है कि change real है, accidental नहीं।
यही reason है कि modern companies, startups और analytics teams हर important decision से पहले hypothesis testing use करती हैं — चाहे वो pricing change हो, marketing campaign हो, या product redesign।
Hypothesis Testing हमें emotional decisions से बचाकर logical, measurable और repeatable decisions की तरफ ले जाती है।
Hypothesis testing protects decisions from bias and anchors them in evidence, not opinions.
Null Hypothesis (H₀) और Alternative Hypothesis (H₁)
Hypothesis Testing की सबसे ज़रूरी foundation
Hypothesis Testing को सही तरीके से समझने के लिए सबसे पहले यह clear होना ज़रूरी है कि Null Hypothesis और Alternative Hypothesis क्या होती हैं। बिना इनके, hypothesis testing possible ही नहीं है।
जब भी हम कोई statistical test करते हैं, हम हमेशा दो hypotheses बनाते हैं — एक default assumption और एक opposite claim।
Null Hypothesis (H₀)
Default assumption “कोई change नहीं हुआ” “सब कुछ पहले जैसा है”
Alternative Hypothesis (H₁)
Opposite assumption “Change हुआ है” “Effect मौजूद है”
Data analytics में हम कभी भी सीधे यह नहीं कहते कि “change हुआ है”। हम पहले मान लेते हैं कि कोई change नहीं हुआ — और फिर data से उस assumption को challenge करते हैं। यही Null Hypothesis की philosophy है।
Null Hypothesis (H₀) क्या होती है?
Null Hypothesis (H₀) वह statement होती है जिसे हम initially true मान लेते हैं। यह हमेशा यह कहती है कि कोई difference, effect या change नहीं है।
Important Rule
Null Hypothesis हमेशा equality sign (=, ≥, ≤) के साथ लिखी जाती है।
Example:
H₀: New teaching method से students के marks में
कोई improvement नहीं हुआ।
इसका मतलब यह नहीं कि H₀ सच है — इसका मतलब सिर्फ यह है कि हम testing की शुरुआत इसी assumption से करते हैं।
Alternative Hypothesis (H₁) क्या होती है?
Alternative Hypothesis (H₁) वह statement होती है जो Null Hypothesis के बिल्कुल opposite होती है। यह change, difference या impact को represent करती है।
Example:
H₁: New teaching method से students के marks में
improvement हुआ है।
Hypothesis Testing का goal यही होता है: data की मदद से यह check करना कि क्या H₀ को reject किया जा सकता है या नहीं।
Key Concept
हम कभी भी H₁ को directly prove नहीं करते। हम सिर्फ यह decide करते हैं कि H₀ reject होगी या नहीं।
Real-Life Example (Easy समझिए)
मान लीजिए एक company कहती है: “New discount offer से sales बढ़ी है।”
H₀
Discount offer से sales में कोई increase नहीं हुआ।
H₁
Discount offer से sales में increase हुआ है।
अब data collect किया जाएगा, statistical test लगाया जाएगा, और फिर decision लिया जाएगा — H₀ reject होगी या नहीं।
Hypothesis Testing में सबसे बड़ी गलती यही होती है कि लोग H₀ और H₁ को उल्टा समझ लेते हैं। याद रखिए — H₀ = No Change, H₁ = Change
In hypothesis testing, we do not try to prove change first. We first assume no change — and let data challenge it.
One-Tailed Test और Two-Tailed Test
Direction समझिए — तभी सही test choose होगा
Hypothesis Testing में सबसे common confusion यह होता है कि One-Tailed Test कब use करें और Two-Tailed Test कब। गलत tail choose करने से सही data होने के बावजूद गलत decision आ सकता है।
Simple rule याद रखिए: आप change की direction पहले से जानते हैं या नहीं — यही decide करता है कि test one-tailed होगा या two-tailed।
One-Tailed Test
Change की direction पहले से fixed होती है (सिर्फ increase या सिर्फ decrease)
Two-Tailed Test
Direction important नहीं बस difference exist करता है या नहीं
One-Tailed Test क्या होता है?
One-Tailed Test तब use किया जाता है जब हमें पहले से पता होता है कि change किस direction में आएगा।
Example:
“New discount देने से sales increase होंगी।”
यहाँ decrease की possibility consider ही नहीं की जा रही।
Hypothesis Example
H₀: New discount से sales ≤ old sales
H₁: New discount से sales > old sales
One-tailed test powerful होता है, लेकिन risk भी ज़्यादा होता है, क्योंकि हम दूसरी direction को ignore कर देते हैं।
Two-Tailed Test क्या होता है?
Two-Tailed Test तब use होता है जब हमें सिर्फ यह जानना है कि difference आया है या नहीं, direction matter नहीं करती।
Example:
“New teaching method से marks में
कोई difference आया है या नहीं।”
Hypothesis Example
H₀: New method के बाद marks = old marks
H₁: New method के बाद marks ≠ old marks
Data analytics और research में ज़्यादातर cases में Two-Tailed Test prefer किया जाता है, क्योंकि यह neutral और safe approach होती है।
One-Tailed vs Two-Tailed (Quick Comparison)
One-Tailed
Direction fixed
Higher power
Higher risk
Two-Tailed
Direction unknown
Safer choice
Widely accepted
याद रखिए — अगर direction को लेकर slightest doubt भी है, तो Two-Tailed Test ही सही choice है।
Choose one-tailed only when direction is certain. Otherwise, two-tailed tests are safer and standard.
Hypothesis Testing के Steps (Complete Process)
Question से लेकर final decision तक
Hypothesis Testing कोई एक formula या calculation नहीं है, बल्कि यह एक logical step-by-step process है। अगर कोई एक step भी गलत हो गया, तो पूरा conclusion misleading हो सकता है।
इसलिए data analytics और statistics में hypothesis testing को हमेशा fixed steps में follow किया जाता है।
Step 1: Problem Statement Clear करना
सबसे पहला और सबसे important step है — आप क्या test करना चाहते हैं?
Example
क्या नई teaching method से marks बढ़े हैं?
क्या discount से sales improve हुई है?
अगर question clear नहीं है, तो hypothesis भी गलत बनेगी।
Step 2: Null और Alternative Hypothesis बनाना
इस step में हम दो statements define करते हैं:
Null Hypothesis (H₀)
कोई change नहीं हुआ
Default assumption
Alternative Hypothesis (H₁)
Change या effect मौजूद है
Opposite claim
Hypothesis Testing हमेशा H₀ से शुरू होती है, H₁ से नहीं।
Step 3: Significance Level (α) Choose करना
Significance level यह बताता है कि हम गलत decision लेने का कितना risk accept कर सकते हैं।
Standard Value
α = 0.05 (5%)
यानी 100 में से 5 बार गलत decision acceptable
Step 4: Right Statistical Test Select करना
हर situation के लिए अलग statistical test use होता है:
Z-Test
Large sample size
T-Test
Small sample size
Chi-Square
Categorical data
ANOVA
More than 2 groups
गलत test select करने से result गलत हो सकता है, चाहे data सही ही क्यों न हो।
Step 5: Test Statistic और P-value निकालना
अब Excel, Python या statistical software की मदद से test statistic और P-value calculate की जाती है।
P-value यह बताती है कि अगर H₀ सच होती, तो ऐसा result आने की probability कितनी थी।
Step 6: Decision लेना (Reject या Accept)
Decision Rule
P-value ≤ 0.05 → H₀ Reject
P-value > 0.05 → H₀ Accept
याद रखिए — हम H₁ को prove नहीं करते, हम सिर्फ यह decide करते हैं कि H₀ reject हो सकती है या नहीं।
Hypothesis Testing का पूरा process guesswork को हटाकर data-driven decisions को possible बनाता है।
Hypothesis testing is not about opinions. It is about structured decisions backed by data.
Significance Level (α) क्या होता है?
गलत decision का risk कितना accept करेंगे?
Hypothesis Testing में Significance Level वह boundary होती है जिसके आधार पर हम decide करते हैं कि Null Hypothesis को reject करना है या नहीं।
Significance Level को Greek symbol α (alpha) से represent किया जाता है। यह पहले से तय किया जाता है, test करने के बाद नहीं।
Simple Meaning
Significance Level यह बताता है कि हम गलत decision लेने का कितना risk accept करने को तैयार हैं।
Statistics में सबसे commonly used value है:
Standard Value
α = 0.05 (5%)
Meaning
100 में से 5 बार गलत decision acceptable
इसका मतलब यह नहीं है कि हम जानबूझकर गलत decision ले रहे हैं, बल्कि इसका मतलब यह है कि real world में 100% certainty possible नहीं होती।
α = 0.05 ही क्यों use किया जाता है?
बहुत से beginners सोचते हैं कि 0.05 कोई random number है, लेकिन ऐसा नहीं है।
Reason 1
यह risk और reliability के बीच best balance बनाता है
Reason 2
Science और research में globally accepted standard
Reason 3
Business decisions के लिए practically safe value
हालाँकि हर field में same value जरूरी नहीं होती।
Medical Research
α = 0.01 (ज़्यादा strict)
Social Science
α = 0.05
Exploratory Analysis
α = 0.10
Court Case Analogy (Easy समझिए)
Hypothesis Testing को आप court trial की तरह समझ सकते हैं।
Null Hypothesis (H₀)
आरोपी निर्दोष है
Alternative Hypothesis (H₁)
आरोपी दोषी है
Court तभी सजा देता है जब evidence बहुत strong हो। उसी तरह statistics में भी हम तभी H₀ reject करते हैं जब P-value ≤ α हो।
Golden Rule
Significance Level test से पहले fix होती है, result देखने के बाद नहीं।
Significance Level हमें याद दिलाता है कि statistics certainty नहीं, probability पर काम करती है।
Significance level defines how much uncertainty we are willing to tolerate in a decision.
P-value क्या होती है?
Hypothesis Testing का सबसे misunderstood concept
Hypothesis Testing में अगर कोई एक term सबसे ज़्यादा confuse करती है, तो वह है P-value। बहुत से students इसे याद तो कर लेते हैं, लेकिन इसका मतलब सही से नहीं समझ पाते।
इस section के बाद P-value को लेकर आपकी सारी confusion clear हो जाएगी।
Simple Definition
P-value यह बताती है कि अगर Null Hypothesis (H₀) सच होती, तो ऐसा result आने की probability कितनी थी।
ध्यान दीजिए — P-value यह नहीं बताती कि hypothesis सही है या गलत। यह सिर्फ यह बताती है कि data H₀ के against कितना strong evidence दे रहा है।
Small P-value
Data H₀ के खिलाफ strong evidence देता है
H₀ reject होने के chances ज़्यादा
Large P-value
Data H₀ के खिलाफ weak evidence देता है
H₀ reject नहीं होती
P-value को आसान भाषा में समझिए
मान लीजिए आप कहते हैं: “इस coin को उछालने पर हमेशा head आता है।”
अब अगर coin 10 बार उछालने पर 9 बार head आ जाए, तो आप सोचेंगे — “कुछ तो गड़बड़ है!”
यही सोच P-value represent करती है। अगर ऐसा result normal condition में बहुत rare है, तो P-value छोटी होगी।
Key Insight
जितना ज़्यादा rare result, उतनी छोटी P-value।
P-value और Significance Level (α) का relation
P-value का decision अकेले नहीं लिया जाता। इसे हमेशा Significance Level (α) से compare किया जाता है।
Decision Rule
P-value ≤ α → Null Hypothesis Reject
P-value > α → Null Hypothesis Accept
Example:
अगर α = 0.05 और P-value = 0.03
तो हम कहेंगे —
result statistically significant है।
Common Misunderstandings (Very Important)
Wrong Belief
P-value = Hypothesis सही होने की probability
Correct Meaning
P-value = Data given H₀ की probability
यही confusion interviews में भी पूछी जाती है, इसलिए इस difference को clear रखना बहुत ज़रूरी है।
P-value कोई magic number नहीं है। यह सिर्फ एक signal है — जो बताता है कि data कितना convincing है।
P-value does not prove truth. It only measures how surprising the data is under the null hypothesis.
Type I Error और Type II Error
False Positive vs False Negative — interview favorite
Hypothesis Testing में decision लेना हमेशा 100% safe नहीं होता। कभी-कभी सही data होने के बावजूद गलत conclusion निकल सकता है। इन्हीं गलतियों को statistics में Errors कहा जाता है।
Hypothesis Testing में मुख्य रूप से दो प्रकार की errors होती हैं: Type I Error और Type II Error।
Type I Error
False Positive
True H₀ को reject कर देना
Type II Error
False Negative
False H₀ को accept कर लेना
Type I Error क्या होती है?
Type I Error तब होती है जब हम Null Hypothesis को reject कर देते हैं, जबकि वह actually true होती है।
Simple Meaning
“Change नहीं था, लेकिन हमने मान लिया कि change है।”
Example:
मान लीजिए कोई नई medicine है
जो असल में काम नहीं करती,
लेकिन test के बाद हम यह conclude कर लें
कि medicine effective है —
यही Type I Error है।
Type I Error का risk सीधे Significance Level (α) से जुड़ा होता है। α जितना बड़ा, Type I Error का chance उतना ज़्यादा।
Type II Error क्या होती है?
Type II Error तब होती है जब हम Null Hypothesis को accept कर लेते हैं, जबकि वह actually false होती है।
Simple Meaning
“Change था, लेकिन हमने मान लिया कि change नहीं है।”
Example:
कोई नई teaching method students के marks बढ़ा रही है,
लेकिन analysis के बाद हम यह conclude कर लें
कि method का कोई effect नहीं है —
यह Type II Error है।
Type II Error ज़्यादातर तब होती है जब sample size छोटा हो या test की power कम हो।
Type I vs Type II Error (Quick Comparison)
Type I Error
H₀ true थी
Reject कर दी
False Positive
Type II Error
H₀ false थी
Accept कर ली
False Negative
Real-Life Analogy (Medical Test)
Type I Error
Healthy person को sick declare कर देना
Type II Error
Sick person को healthy declare कर देना
दोनों errors dangerous हो सकती हैं, लेकिन situation के हिसाब से एक error दूसरी से ज़्यादा costly हो सकती है।
Hypothesis Testing का goal errors को पूरी तरह हटाना नहीं, बल्कि उनके risk को control करना होता है।
Statistics is not about avoiding mistakes, but about managing their probabilities.
Z-Test, T-Test, Chi-Square और ANOVA
कौन-सा test कब use करें? (Quick decision guide)
Hypothesis Testing में सबसे common सवाल यही होता है — “कौन-सा statistical test कब use करना चाहिए?” गलत test चुनने से result misleading हो सकता है, इसलिए tests की basic understanding बहुत ज़रूरी है।
इस section में हम चार सबसे popular tests का high-level overview समझेंगे — detail अगले sections में आएगी।
Z-Test क्या होता है?
Z-Test तब use किया जाता है जब sample size बड़ा हो और population variability अच्छी तरह known हो।
When to Use
Large sample size (n > 30)
Population standard deviation known
Common Use Case
Production quality check
Large-scale survey analysis
Real-life में Z-Test कम use होता है, क्योंकि population standard deviation ज़्यादातर cases में available नहीं होती।
T-Test क्या होता है?
T-Test सबसे ज़्यादा used hypothesis test है। यह तब use होता है जब sample size छोटा हो और population standard deviation unknown हो।
Types of T-Test
One-Sample T-Test
Two-Sample T-Test
Paired T-Test
Use Case
Student marks comparison
Sales before vs after analysis
Data analytics interviews में T-Test almost always पूछा जाता है, इसलिए इसे अच्छे से समझना ज़रूरी है।
Chi-Square Test क्या होता है?
Chi-Square Test categorical data के लिए use होता है। यह यह check करता है कि दो categories के बीच कोई relationship या dependency है या नहीं।
Data Type
Categorical / Qualitative
(Yes/No, Male/Female)
Use Case
Gender vs purchase decision
Education level vs employment
Surveys और questionnaires analysis में Chi-Square test बहुत popular है।
ANOVA क्या होता है?
ANOVA (Analysis of Variance) तब use किया जाता है जब हमें 2 से ज़्यादा groups compare करने हों।
Purpose
Multiple means comparison
One-way / Two-way ANOVA
Use Case
3 teaching methods comparison
Multiple product pricing test
ANOVA यह नहीं बताता कि कौन-सा group अलग है, बल्कि यह बताता है कि कम से कम एक group अलग है।
Quick Selection Guide (Remember This)
Mean compare (2 groups)
T-Test
Mean compare (>2 groups)
ANOVA
Category relationship
Chi-Square
Large sample + known σ
Z-Test
सही statistical test चुनना hypothesis testing की आधी जीत है।
Choosing the right test matters as much as interpreting the result.
Hypothesis Testing – Complete Real-Life Example
Step-by-step case study (Beginner friendly)
अभी तक आपने Hypothesis Testing के सारे concepts अलग-अलग समझ लिए। अब इन्हें जोड़कर एक complete real-life case study देखते हैं, ताकि पूरा flow clear हो जाए।
Case Study: New Teaching Method का Impact
मान लीजिए एक coaching institute (Vista Academy जैसे) ने एक नई teaching method introduce की। Management का claim है:
Business Claim
“New teaching method से students के marks improve हुए हैं।”
अब यह claim belief नहीं, data से verify किया जाएगा — यानी Hypothesis Testing।
Step 1: Problem Statement
हमारा question है: क्या नई teaching method से students के average marks में statistically significant improvement हुआ है?
Step 2: Hypothesis Formulation
Null Hypothesis (H₀)
New teaching method से students के marks में कोई improvement नहीं हुआ।
Alternative Hypothesis (H₁)
New teaching method से students के marks में improvement हुआ है।
क्योंकि हमें direction पता है (improvement), यहाँ One-Tailed Test use होगा।
Step 3: Significance Level (α)
हम standard value choose करते हैं:
α Value
α = 0.05
(5% risk acceptable)
Step 4: Test Selection
Situation:
Sample Size
छोटा (n < 30)
Data Type
Numerical (Marks)
इसलिए यहाँ Paired T-Test use किया जाएगा (same students before vs after)।
Step 5: P-value Calculation
Excel / Python से analysis करने पर हमें मिला:
Result
P-value = 0.02
Step 6: Decision
Decision rule apply करते हैं:
Decision Rule
P-value (0.02) < α (0.05)
👉 Null Hypothesis Reject
Step 7: Final Conclusion (Business Language)
Statistical language को business language में convert करते हैं:
Conclusion
“Data के आधार पर यह पाया गया कि नई teaching method का students के marks पर statistically significant positive impact है।”
यही complete flow है — assumption से लेकर data-driven decision तक।
A good hypothesis test does not end with numbers. It ends with a clear decision.
Excel में Hypothesis Testing कैसे करें? (Complete Practical)
Real example + step-by-step Excel execution
Excel उन students और professionals के लिए best tool है जो बिना coding के Hypothesis Testing practically सीखना चाहते हैं। Excel में हम आसानी से यह check कर सकते हैं कि कोई change सच में effective है या सिर्फ coincidence।
Practical Example (Real Case)
मान लीजिए Vista Academy ने एक नई teaching method start की। हमारे पास 10 students के marks हैं:
Before Method
52, 55, 60, 58, 62, 57, 59, 61, 56, 60
After Method
58, 60, 65, 63, 68, 62, 64, 66, 61, 65
Question: क्या नई teaching method से students के marks statistically significantly बढ़े हैं?
Step 1: Hypothesis Define करें
Null Hypothesis (H₀)
New method से marks में कोई improvement नहीं हुआ
Alternative Hypothesis (H₁)
New method से marks improve हुए हैं
क्योंकि same students के before और after marks compare हो रहे हैं, यहाँ Paired T-Test use होगा।
Step 2: Excel में Data Setup
Excel sheet में data इस तरह enter करें:
Column A
Marks Before
Column B
Marks After
👉 Important: Rows perfectly aligned होने चाहिए (same student = same row)
Step 3: Data Analysis ToolPak Enable करें
Enable Path
File → Options → Add-ins
Manage: Excel Add-ins → Go
✔ Analysis ToolPak → OK
Enable होने के बाद Data tab में “Data Analysis” दिखाई देगा।
Step 4: Paired T-Test Run करें
Follow these exact steps:
Navigation
Data → Data Analysis → T-Test: Paired Two Sample for Means
Inputs
Variable 1 Range → A2:A11
Variable 2 Range → B2:B11
Settings
Hypothesized Mean Difference = 0
Alpha = 0.05
Output
Output Range select करें
(e.g. D2)
अब OK पर click करें।
Step 5: Excel Output को कैसे Read करें?
Excel output में बहुत सारी values होंगी, लेकिन decision के लिए सिर्फ यह देखिए:
P(T≤t) one-tail
Example: 0.002
Alpha (α)
0.05
Decision Rule
0.002 < 0.05
👉 Null Hypothesis Reject
Step 6: Final Conclusion (Exam + Business Ready)
Conclusion Statement
Excel analysis के आधार पर यह पाया गया कि नई teaching method का students के marks पर statistically significant positive impact है।
Excel में Hypothesis Testing समझ लेने के बाद Python और Power BI में यही logic repeat होता है — सिर्फ tools बदलते हैं।
Excel builds the foundation. Python only automates the same thinking.
Python में Hypothesis Testing कैसे करें?
Same logic as Excel, just automated & scalable
Excel में Hypothesis Testing सीखने के बाद अगला natural step होता है Python। Python वही logic follow करता है, बस difference इतना है कि Python large data और automation के लिए best है।
Data Analyst और Data Scientist roles में Python-based hypothesis testing industry standard मानी जाती है।
Python में Hypothesis Testing के लिए क्या चाहिए?
Libraries
numpy
scipy.stats
Why Python?
Fast calculation
Reproducible results
Industry ready
Note: आपको heavy coding नहीं आनी चाहिए — बस logic clear होना चाहिए।
Same Example (Marks Before vs After)
हम वही data use करेंगे जो Excel example में था:
Before Marks
52, 55, 60, 58, 62, 57, 59, 61, 56, 60
After Marks
58, 60, 65, 63, 68, 62, 64, 66, 61, 65
Question वही है: क्या नई teaching method से marks statistically significantly बढ़े हैं?
Step 1: Hypothesis Define करें
H₀ (Null Hypothesis)
New method से marks में कोई improvement नहीं
H₁ (Alternative Hypothesis)
New method से marks improve हुए हैं
Same students का before vs after comparison है, इसलिए यहाँ भी Paired T-Test use होगा।
Step 2: Python Code (Paired T-Test)
Python Code
from scipy import stats

before = [52,55,60,58,62,57,59,61,56,60]
after  = [58,60,65,63,68,62,64,66,61,65]

t_stat, p_value = stats.ttest_rel(after, before)

print("T-statistic:", t_stat)
print("P-value:", p_value)
Step 3: Output को कैसे समझें?
Python आपको दो main values देगा:
T-statistic
Difference की strength दिखाता है
P-value
Data कितना convincing है H₀ के against
मान लीजिए output आया:
Sample Output
P-value = 0.0018
Step 4: Decision Rule Apply करें
Decision
α = 0.05
P-value (0.0018) < 0.05
👉 Null Hypothesis Reject
Conclusion वही रहेगा जो Excel में आया था — बस tool change हुआ है।
Python vs Excel (Quick Comparison)
Excel
Beginner friendly
Small datasets
Manual steps
Python
Automation
Large datasets
Industry standard
Hypothesis Testing का logic Excel और Python दोनों में same रहता है। Skill grow होती है, tool बदलता है।
Excel teaches thinking. Python scales that thinking.
Hypothesis Testing – Interview Questions
Freshers से लेकर experienced professionals तक
Hypothesis Testing interview का एक core topic है — खासकर Data Analyst, Business Analyst, Data Scientist और MIS roles के लिए। नीचे questions को Freshers और Experienced दो हिस्सों में divide किया गया है।
Part A: Interview Questions for Freshers
1. Hypothesis Testing क्या है?
Hypothesis Testing एक statistical method है जिसकी मदद से हम data के आधार पर किसी assumption या claim को verify करते हैं।
2. Null Hypothesis और Alternative Hypothesis में क्या difference है?
Null Hypothesis (H₀) कहती है कि कोई change नहीं हुआ है, जबकि Alternative Hypothesis (H₁) change या effect को represent करती है।
3. P-value क्या होती है?
P-value यह बताती है कि अगर H₀ सच होती, तो ऐसा result आने की probability कितनी थी।
4. Significance Level (α) क्या होता है?
Significance Level यह बताता है कि हम गलत decision लेने का कितना risk accept कर सकते हैं। आमतौर पर α = 0.05 use किया जाता है।
5. One-Tailed और Two-Tailed Test में क्या difference है?
One-tailed test में direction पहले से fixed होती है, जबकि two-tailed test में direction matter नहीं करती।
6. Type I Error क्या होती है?
जब H₀ true होने के बावजूद हम उसे reject कर देते हैं, तो उसे Type I Error कहते हैं।
7. Type II Error क्या होती है?
जब H₀ false होने के बावजूद हम उसे accept कर लेते हैं, तो उसे Type II Error कहते हैं।
Part B: Interview Questions for Experienced Candidates
8. Hypothesis Testing और Confidence Interval में क्या difference है?
Hypothesis Testing decision-based approach है (reject / accept), जबकि Confidence Interval range-based estimate देता है।
9. P-value छोटी होने का मतलब हमेशा practical significance होता है?
नहीं। Statistical significance और practical significance अलग concepts हैं। Large sample में छोटी difference भी significant दिख सकती है।
10. Type I और Type II Error में trade-off कैसे handle करते हैं?
α कम करने से Type I Error कम होती है, लेकिन Type II Error बढ़ सकती है। Business context के हिसाब से balance decide किया जाता है।
11. Wrong test select करने से क्या impact पड़ता है?
Wrong test selection से false conclusions निकल सकते हैं, जिससे business decisions गलत हो सकते हैं।
12. A/B Testing और Hypothesis Testing में relation क्या है?
A/B Testing वास्तव में Hypothesis Testing का practical business application है।
13. Sample size hypothesis testing को कैसे affect करता है?
Small sample में Type II Error का risk बढ़ता है, जबकि large sample results को ज़्यादा reliable बनाता है।
14. Hypothesis Testing को real business decision में कैसे explain करेंगे?
Statistical terms छोड़कर, simple language में यह बताया जाता है कि “data change को support करता है या नहीं”।
Interview Tips (Vista Academy Special)
Tip 1
Definition के साथ real-life example ज़रूर जोड़ें
Tip 2
P-value का wrong meaning कभी न बोलें
Tip 3
Excel या Python example mention करें
Interviewer यह नहीं देखता कि आपको कितने formulas याद हैं, वह यह देखता है कि आप decision-making logic समझते हैं या नहीं।
Interviews test clarity of thinking, not memorization of formulas.
Hypothesis Testing – Interactive Quiz
Click an option to check your answer
Q1. Hypothesis Testing का मुख्य उद्देश्य क्या है?
Q2. Null Hypothesis (H₀) क्या दर्शाती है?
Q3. P-value क्या बताती है?
Q4. P-value ≤ 0.05 होने पर क्या decision लिया जाता है?
Q5. Same students के before–after marks compare करने के लिए सही test?
Option पर click करते ही feedback मिलता है — यही active learning है।
Immediate feedback improves concept retention.
Related Learning Resources (Vista Academy)
Hypothesis Testing से जुड़े important topics
📊 Data Analytics Basics
Hypothesis Testing समझने से पहले
Data Analytics का foundation clear होना ज़रूरी है।
👉
Data Analytics क्या है? (Hindi)
📈 Statistics for Data Analysts
Hypothesis Testing statistics का हिस्सा है।
Mean, Median, Variance और Distribution समझना ज़रूरी है।
👉
Data Science & Statistics (Hindi)
📉 Excel for Analytics
Excel में T-Test और ANOVA सीखना चाहते हैं?
👉
Analytics Tools & Practice
💰 Career & Salary Insight
Hypothesis Testing कहाँ use होती है
और salary पर इसका impact क्या है?
👉
Data Analyst Salary in India