
If you are starting your journey in data cleaning with Python, the first step is understanding what Pandas in Python really is. In this section, we explain the basics of Pandas, DataFrame (df), and why it is the most popular tool for data manipulation and data cleansing in Python.
Answer: Pandas is an open-source Python library used for
data analysis, cleaning, and manipulation. It provides flexible data
structures like Series (1-D) and DataFrame (2-D) to work with
structured data (tables, CSVs, Excel, SQL queries).
Answer: Pandas is mainly used for:
Answer: In simple terms, Pandas are powerful Python tools that help turn raw data into clean, structured tables so analysts can focus on insights instead of messy datasets.
Answer: In Pandas, df is a common variable name used for
a DataFrame. A DataFrame is a 2D table of rows and columns, just like an
Excel sheet or SQL table.
import pandas as pd
df = pd.read_csv("data.csv")
print(df.head())  # displays first 5 rows
Answer: Pandas is the library, while df
(DataFrame) is the data structure created using Pandas to store and
manipulate tabular data.
Answer: Pandas is the industry standard for Python data cleaning because it offers powerful built-in functions for handling missing data, removing duplicates, data type conversion, and filtering outliers—all with simple, readable syntax that saves hours of manual coding.
Learn advanced techniques for handling missing values, duplicates, and outliers in the next section.
A common step in data cleaning with Python is importing data from
external files. With Pandas, you can easily load CSV and Excel files
into a DataFrame (df) for further analysis. This is where terms like
“csv to pandas” or “python import csv as dataframe” come in.
Answer: Use the read_csv() function to load CSV data
directly into a DataFrame.
import pandas as pd

# Load CSV into DataFrame
df = pd.read_csv("data.csv")

# Preview first 5 rows
print(df.head())
👉 This is the most common way for pandas load csv and import csv python pandas.
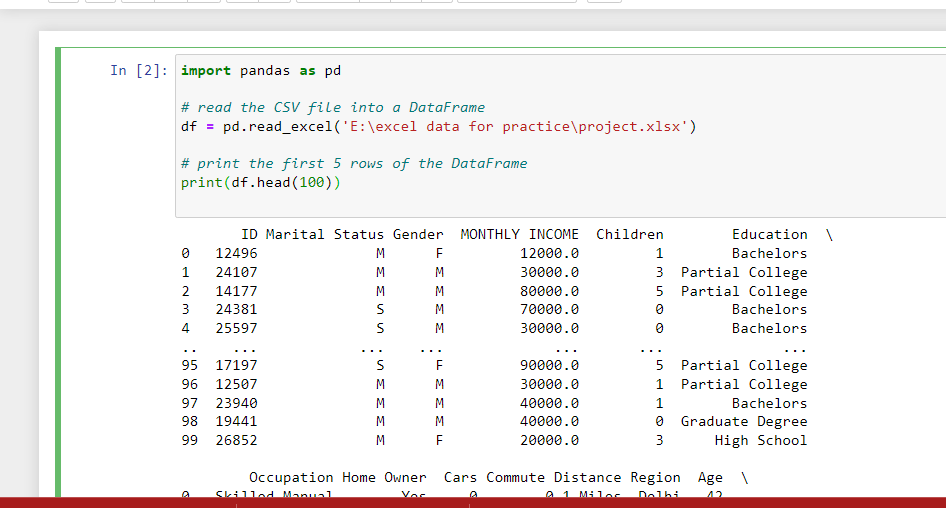
Answer: Use the read_excel() function to load Excel
sheets into Pandas.
# Load Excel file
df_excel = pd.read_excel("data.xlsx")

# Display first 5 rows
print(df_excel.head())
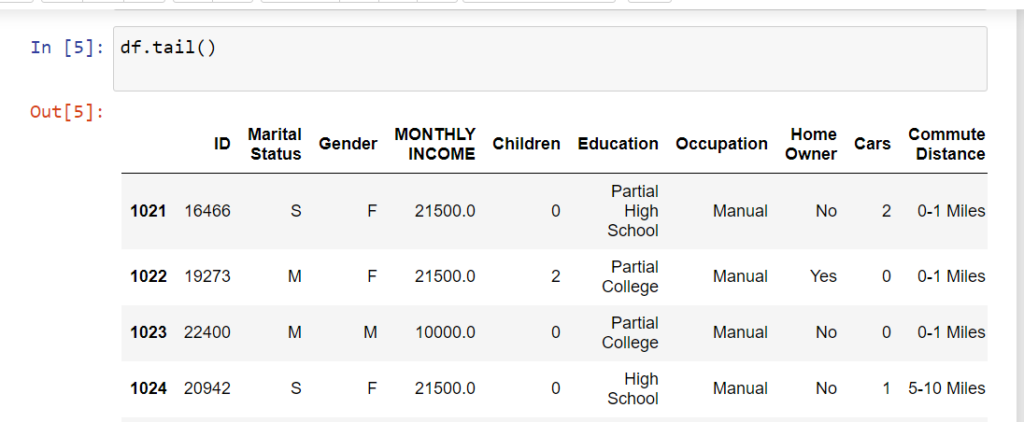
Answer: After importing, use
head() to preview rows and describe()
to get statistical summaries.
# Preview first 10 rows
print(df.head(10))

# Get data summary
print(df.describe())
📊 Now that you can load files into Pandas, let’s move to data cleaning methods such as handling missing values.
Next: Handling Missing Values →head() Method in Python
The head() function in Pandas is used to quickly preview the first few rows of a DataFrame (df).
Commonly searched as “pandas head method” or “what is df in Python”.
import pandas as pd

# Sample DataFrame
data = {'Name': ['Amit', 'Priya', 'Ravi', 'Sneha', 'Karan', 'Anjali'],
        'Age': [23, 25, 22, 24, 28, 21]}
df = pd.DataFrame(data)

# Display first 5 rows
print(df.head())

# Display first 3 rows
print(df.head(3))
   Name   Age
0  Amit   23
1  Priya  25
2  Ravi   22
3  Sneha  24
4  Karan  28
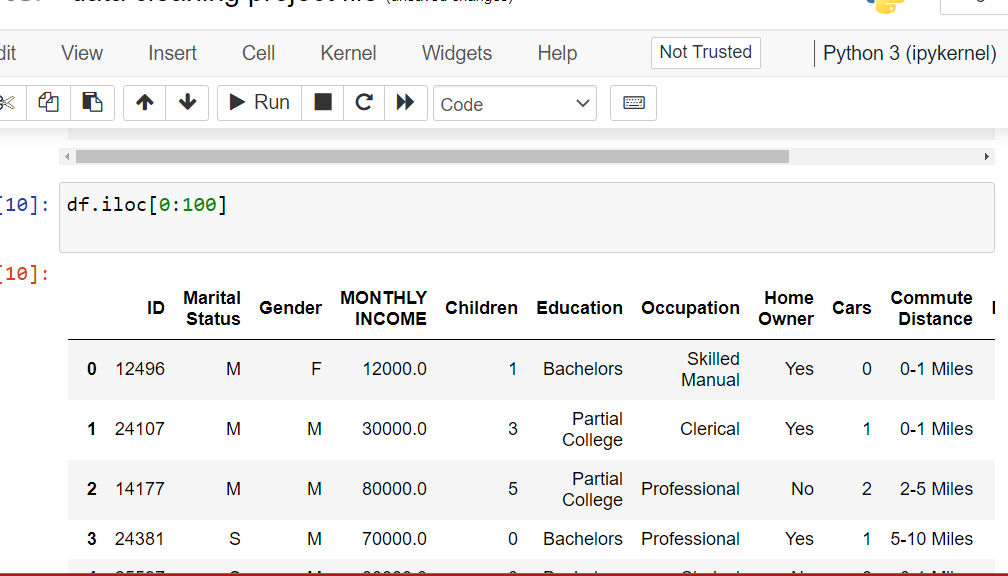
Select rows and columns by position
Use iloc to select rows and columns by integer index.
This is one of the most essential techniques for data cleaning in Python
and manipulating df in Python. Understanding iloc helps you
filter specific rows, extract subsets, and perform targeted data operations.
Let’s create a sample DataFrame and explore different ways to use iloc:
import pandas as pd

# Sample DataFrame
data = {'Name': ['Amit', 'Priya', 'Ravi', 'Sneha', 'Karan'],
        'Age': [23, 25, 22, 24, 28]}
df = pd.DataFrame(data)

# Select single row (first row)
print(df.iloc[0])

# Select multiple rows (first 3 rows)
print(df.iloc[0:3])

# Select specific cell (row 1, column 'Name')
print(df.iloc[1, 0])
Output:
Name    Amit
Age       23
Name: 0, dtype: object

    Name   Age
0   Amit   23
1  Priya   25
2   Ravi   22

Priya
df.iloc[0] returns the first row as a Series object with column names as index.
df.iloc[0:3] selects rows from index 0 to 2 (3 is excluded). Returns a DataFrame.
df.iloc[1, 0] gets the value at row 1, column 0. First number = row, second = column.
# Get last 3 rows
print(df.iloc[-3:])

# Get last row only
print(df.iloc[-1])
Use negative indexing to select from the end of the DataFrame.
# Get all rows, first column only
print(df.iloc[:, 0])

# Get all rows, multiple columns (0 and 1)
print(df.iloc[:, [0, 1]])
The colon : means “all rows”, then specify column positions.
# Get first 3 rows, all columns
print(df.iloc[0:3, :])

# Get first 2 rows, first column
print(df.iloc[0:2, 0])

# Get specific rows and columns
print(df.iloc[[0, 2, 4], [0, 1]])
Use lists inside iloc to select non-consecutive rows or columns.
Clean headers or footers: df = df.iloc[1:-1] removes first and last rows.
Quick inspection: df.iloc[:10] shows first 10 rows without using head().
Split datasets: train = df.iloc[:800] and test = df.iloc[800:] for ML models.
iloc uses positions (integers), loc uses labels (names)iloc is faster for large datasets when you know exact positions[start:end] excludes the end index (like Python lists)Next up: Learn loc for label-based indexing and conditional filtering in Pandas.
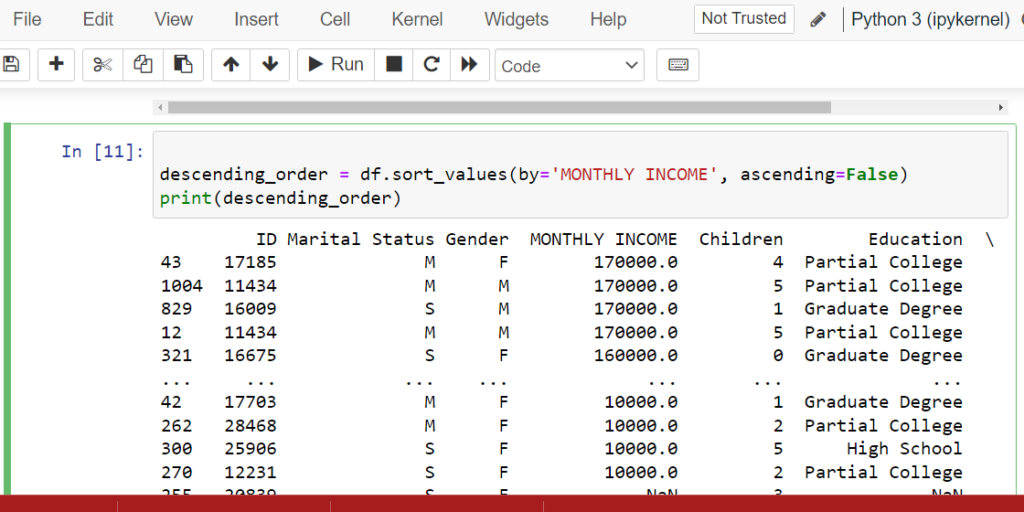
sort_values() & sort_index())Organize your data for better analysis
Use sort_values() to sort by column values and sort_index() to sort by index.
Sorting is essential for data cleaning in Python when you need to identify top/bottom values,
detect patterns, or prepare data for visualization. Master these pandas sort methods to
streamline your data analysis workflow.
Let’s create a DataFrame and explore both sorting methods:
import pandas as pd

# Sample DataFrame
data = {'Name': ['Amit', 'Priya', 'Ravi', 'Sneha'],
        'Monthly Income': [50000, 70000, 45000, 60000]}
df = pd.DataFrame(data)

# Sort by index (descending)
print(df.sort_index(axis=0, ascending=False))

# Sort by column values (Monthly Income descending)
descending_order = df.sort_values(by='Monthly Income', ascending=False)
print(descending_order)
Output:
    Name   Monthly Income
3  Sneha           60000
2   Ravi           45000
1  Priya           70000
0   Amit           50000

    Name   Monthly Income
1  Priya           70000
3  Sneha           60000
0   Amit           50000
2   Ravi           45000
Sorts DataFrame by one or more column values. Use by='column_name' parameter. Default is ascending order.
Sorts DataFrame by row index or column names. Use axis=0 for rows, axis=1 for columns.
Set ascending=False for descending order (highest to lowest). Works with both methods.
# Sort by Age (ascending), then by Salary (descending)
df_sorted = df.sort_values(by=['Age', 'Salary'],
                           ascending=[True, False])
print(df_sorted)
Pass a list of column names to by parameter. Use list of booleans for different sort orders.
# Modify original DataFrame instead of creating new one
df.sort_values(by='Monthly Income', inplace=True)
print(df)
Use inplace=True to sort the DataFrame permanently without reassignment.
# Put NaN values at the beginning
df.sort_values(by='Age', na_position='first')

# Put NaN values at the end (default)
df.sort_values(by='Age', na_position='last')
Control where NaN values appear using na_position parameter.
# Sort and reset index to sequential numbers
df_sorted = df.sort_values(by='Name').reset_index(drop=True)
print(df_sorted)
Use reset_index(drop=True) to get clean sequential index after sorting.
top_5 = df.sort_values('Sales', ascending=False).head(5) – Get top 5 sales records instantly.
lowest = df.sort_values('Price').head(10) – Spot unusually low prices for data validation.
df.sort_values('Name') – Sort customer names, product lists, or categories alphabetically.
df.sort_values('Date') – Arrange data chronologically for trend analysis and forecasting.
Many users search for “jupyter ascending” when learning Pandas sorting.
The ascending parameter works the same in Jupyter notebooks as in regular Python scripts:
Smallest to largest (A to Z, 1 to 100). Perfect for finding minimum values or starting alphabetically.
Largest to smallest (Z to A, 100 to 1). Use for rankings, top performers, or reverse alphabetical order.
sort_values() creates a new DataFrame by default – use inplace=True for large datasetskey=lambda x: x.str.lower() for case-insensitivesort_index() after operations that mess up row orderdf.sort_values('Age')
df.sort_values('Salary', ascending=False)
df.sort_values(['City', 'Age'])
df.sort_index(ascending=False)
df.sort_values('Score', ascending=False).head(10)
df.sort_index(axis=1)
Next: Discover how to filter and select data using conditions and boolean indexing in Pandas.
fillna() & dropna()Fill or remove missing data in your DataFrame
After detecting missing values with isnull(), the next step is handling them. Use fillna()
to replace missing values with specific data, or dropna() to remove rows/columns with missing data.
These are essential data cleaning techniques in Python for preparing datasets for analysis and
machine learning models.
fillna() to Replace Missing ValuesThe fillna() method fills missing values with a specified value or strategy:
import pandas as pd
import numpy as np

# Sample DataFrame with missing values
data = {'Name': ['Amit', 'Priya', 'Ravi', 'Sneha'],
        'Age': [25, np.nan, 30, np.nan],
        'Salary': [50000, 60000, np.nan, 70000]}
df = pd.DataFrame(data)

print("Original DataFrame:")
print(df)

# Fill missing values with 0
df_filled = df.fillna(0)
print("\nAfter fillna(0):")
print(df_filled)

# Fill with column mean
df['Age'].fillna(df['Age'].mean(), inplace=True)
print("\nAfter filling Age with mean:")
print(df)
Output:
Original DataFrame:
    Name   Age   Salary
0   Amit  25.0  50000.0
1  Priya   NaN  60000.0
2   Ravi  30.0      NaN
3  Sneha   NaN  70000.0

After fillna(0):
    Name   Age   Salary
0   Amit  25.0  50000.0
1  Priya   0.0  60000.0
2   Ravi  30.0      0.0
3  Sneha   0.0  70000.0

After filling Age with mean:
    Name   Age   Salary
0   Amit  25.0  50000.0
1  Priya  27.5  60000.0
2   Ravi  30.0      NaN
3  Sneha  27.5  70000.0
df.fillna(0) or df.fillna('Unknown') – Replace all NaN with a fixed value.
df.fillna(df.mean()) – Use statistical measures for numerical columns. Best for normally distributed data.
df.fillna(method='ffill') – Copy previous value downward. Great for time series data.
df.fillna(method='bfill') – Copy next value upward. Useful when future data is more relevant.
# Fill each column with specific value
fill_values = {'Age': 0, 'Salary': df['Salary'].median(), 'City': 'Unknown'}
df.fillna(value=fill_values, inplace=True)
print(df)
Use a dictionary to specify different fill values for each column.
# Fill categorical columns with mode
df['Category'].fillna(df['Category'].mode()[0], inplace=True)

# Or for multiple columns
for col in ['City', 'Department']:
    df[col].fillna(df[col].mode()[0], inplace=True)
Best for categorical data – fills with the most common value.
# Interpolate missing values
df['Temperature'].interpolate(method='linear', inplace=True)

# For time-based interpolation
df['Sales'].interpolate(method='time', inplace=True)
Estimates missing values based on surrounding data points. Perfect for continuous data.
# Fill based on condition
df.loc[df['City'] == 'Delhi', 'Salary'] = \
    df.loc[df['City'] == 'Delhi', 'Salary'].fillna(75000)

# Or using np.where
import numpy as np
df['Age'] = np.where(df['Age'].isnull(),
                     df.groupby('Department')['Age'].transform('mean'),
                     df['Age'])
Fill missing values differently based on category or group.
dropna() to Remove Missing ValuesThe dropna() method removes rows or columns containing missing values:
import pandas as pd
import numpy as np

# Sample DataFrame
data = {'A': [1, 2, np.nan, 4],
        'B': [5, np.nan, np.nan, 8],
        'C': [9, 10, 11, 12]}
df = pd.DataFrame(data)

print("Original DataFrame:")
print(df)

# Drop rows with any missing values
df_dropped = df.dropna()
print("\nAfter dropna() - Remove rows:")
print(df_dropped)

# Drop columns with any missing values
df_dropped_cols = df.dropna(axis=1)
print("\nAfter dropna(axis=1) - Remove columns:")
print(df_dropped_cols)
Output:
Original DataFrame:
     A    B   C
0  1.0  5.0   9
1  2.0  NaN  10
2  NaN  NaN  11
3  4.0  8.0  12

After dropna() - Remove rows:
     A    B   C
0  1.0  5.0   9
3  4.0  8.0  12

After dropna(axis=1) - Remove columns:
    C
0   9
1  10
2  11
3  12
axis=0 (default) drops rows, axis=1 drops columns with missing values.
how='any' (default) drops if ANY value is missing, how='all' only if ALL values missing.
thresh=3 keeps rows with at least 3 non-null values. Good for sparse datasets.
subset=['Age', 'Salary'] only considers specific columns when dropping.
# Only drop completely empty rows
df.dropna(how='all', inplace=True)

# Example use case
df = pd.DataFrame({
    'A': [1, np.nan, np.nan],
    'B': [2, np.nan, np.nan],
    'C': [3, 4, np.nan]
})
df.dropna(how='all')  # Only row 1 is dropped
Useful when you have placeholder rows that are completely empty.
# Keep rows with at least 3 non-null values
df.dropna(thresh=3, inplace=True)

# For a 5-column dataset, keep rows with at least 80% data
min_count = int(len(df.columns) * 0.8)
df.dropna(thresh=min_count, inplace=True)
Balance between keeping data and maintaining quality.
# Only drop if critical columns have missing values
df.dropna(subset=['CustomerID', 'OrderDate'], inplace=True)

# Keep rows where at least one key column is filled
df.dropna(subset=['Email', 'Phone'], how='all', inplace=True)
Preserve data by only checking columns that are absolutely required.
# Drop columns with more than 50% missing values
threshold = 0.5
missing_pct = df.isnull().mean()
cols_to_drop = missing_pct[missing_pct > threshold].index
df.drop(columns=cols_to_drop, inplace=True)

print(f"Dropped columns: {list(cols_to_drop)}")
Automatically remove low-quality columns from your dataset.
df_clean = df.dropna() instead of inplace=True until certaindf.describe() vs df_clean.describe()import pandas as pd
import numpy as np
# Load dataset
df = pd.read_csv('customer_data.csv')
# Step 1: Analyze missing values
print("Missing values per column:")
print(df.isnull().sum())
# Step 2: Handle numerical columns - fill with median
numerical_cols = ['Age', 'Income', 'Transaction_Amount']
for col in numerical_cols:
if df[col].isnull().sum() > 0:
median_value = df[col].median()
df[col].fillna(median_value, inplace=True)
print(f"Filled {col} with median: {median_value}")
# Step 3: Handle categorical columns - fill with mode
categorical_cols = ['City', 'Product_Category']
for col in categorical_cols:
if df[col].isnull().sum() > 0:
mode_value = df[col].mode()[0]
df[col].fillna(mode_value, inplace=True)
print(f"Filled {col} with mode: {mode_value}")
# Step 4: Drop rows where critical columns are missing
critical_cols = ['Customer_ID', 'Order_Date']
df.dropna(subset=critical_cols, inplace=True)
# Step 5: Drop columns with >70% missing data
threshold = 0.7
missing_pct = df.isnull().mean()
cols_to_drop = missing_pct[missing_pct > threshold].index
if len(cols_to_drop) > 0:
df.drop(columns=cols_to_drop, inplace=True)
print(f"Dropped high-missing columns: {list(cols_to_drop)}")
# Step 6: Verify cleaning
print(f"\nFinal missing values:")
print(df.isnull().sum())
print(f"\nDataset shape: {df.shape}")
# Save cleaned data
df.to_csv('customer_data_cleaned.csv', index=False)
df.fillna(0)
df['Age'].fillna(df['Age'].mean())
df.fillna(method='ffill')
df.dropna()
df.dropna(axis=1)
df.dropna(how='all')
df.dropna(thresh=3)
df.dropna(subset=['Age', 'Salary'])
Next: Learn how to remove duplicate rows and handle data type conversions in Pandas.
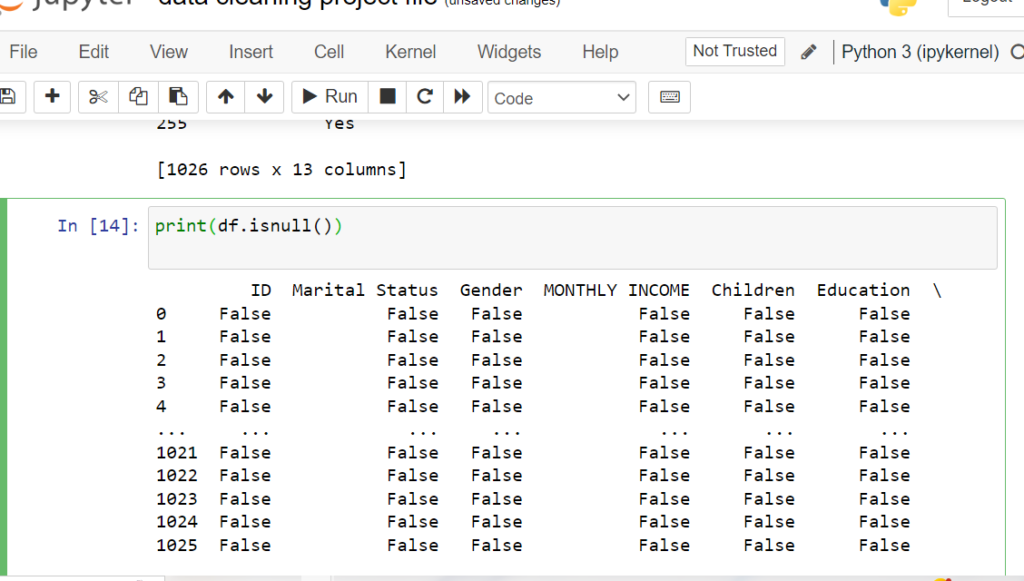
Pinpoint exactly where missing data exists
Use isnull() with any() and sum() to find missing values in columns,
and filter rows containing null values. This targeted approach to Python data cleansing helps
you understand the scope of missing data and make informed decisions about which columns with missing
values in Pandas need attention during data cleaning.
Let’s identify which columns and rows contain missing values:
import pandas as pd
# Sample DataFrame
data = {'Name': ['Amit', 'Priya', 'Ravi', 'Sneha'],
'Age': [25, None, 30, None],
'City': ['Delhi', 'Mumbai', None, 'Pune']}
df = pd.DataFrame(data)
# Columns with missing values
print(df.isnull().any(axis=0))
# Count missing values per column
print(df.isnull().sum())
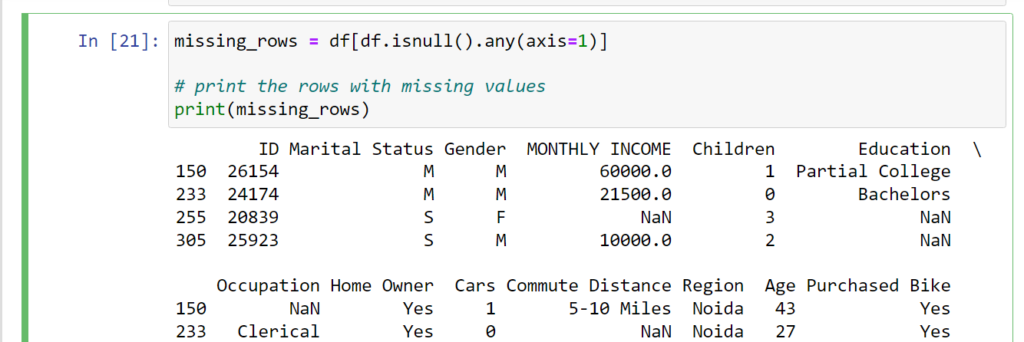
# Rows with missing values
missing_rows = df[df.isnull().any(axis=1)]
print(missing_rows)
Output:
Name    False
Age      True
City     True
dtype: bool

Name    0
Age     2
City    1
dtype: int64

    Name   Age    City
1  Priya   NaN  Mumbai
2   Ravi  30.0     NaN
3  Sneha   NaN    Pune
any() vs all()Returns True for columns that have at least one missing value. Default behavior for column-wise check.
Returns True for rows that have at least one missing value. Use to filter incomplete rows.
Returns True only if all values are missing. Useful for finding completely empty columns/rows.
# Method 1: Using any()
cols_with_missing = df.columns[df.isnull().any()].tolist()
print(f"Columns with missing values: {cols_with_missing}")

# Method 2: Using sum() and filtering
missing_counts = df.isnull().sum()
cols_with_missing = missing_counts[missing_counts > 0].index.tolist()
print(f"Columns with missing data: {cols_with_missing}")
Returns a clean list of column names for further processing.
# Get columns that are completely filled
complete_cols = df.columns[df.notnull().all()].tolist()
print(f"Complete columns: {complete_cols}")

# Alternative method
complete_cols = df.columns[df.isnull().sum() == 0].tolist()
print(f"Columns with no missing data: {complete_cols}")
Identify which columns are already clean and ready for analysis.
# Sort columns by number of missing values (descending)
missing_counts = df.isnull().sum().sort_values(ascending=False)
print("Columns ranked by missing data:")
print(missing_counts)

# Get top 5 columns with most missing values
top_missing = df.isnull().sum().nlargest(5)
print("\nTop 5 columns with most missing values:")
print(top_missing)
Prioritize which columns need immediate attention during data cleaning.
# Find columns with more than 30% missing values
threshold = 0.3
missing_pct = df.isnull().mean()
high_missing_cols = missing_pct[missing_pct > threshold].index.tolist()

print(f"Columns with >{threshold*100}% missing:")
for col in high_missing_cols:
    pct = missing_pct[col] * 100
    print(f"  {col}: {pct:.2f}%")
Automatically identify low-quality columns that may need to be dropped.
# Get index positions of rows with missing data
rows_with_missing_idx = df[df.isnull().any(axis=1)].index.tolist()
print(f"Row indices with missing values: {rows_with_missing_idx}")

# Count how many rows have missing data
num_rows_missing = df.isnull().any(axis=1).sum()
print(f"Total rows with missing data: {num_rows_missing}")
Useful for logging or targeted row-by-row processing.
# Count missing values per row
missing_per_row = df.isnull().sum(axis=1)
print("Missing values per row:")
print(missing_per_row)

# Get rows with 2 or more missing values
rows_multiple_missing = df[missing_per_row >= 2]
print("\nRows with 2+ missing values:")
print(rows_multiple_missing)
Identify rows with severe data quality issues.
# Find rows where ALL values are missing
completely_empty_rows = df[df.isnull().all(axis=1)]
print("Completely empty rows:")
print(completely_empty_rows)

# Get count
num_empty = df.isnull().all(axis=1).sum()
print(f"\nNumber of completely empty rows: {num_empty}")
Detect placeholder or corrupted rows that should be removed.
# Get rows where specific columns have missing values
rows_missing_age = df[df['Age'].isnull()]
print("Rows with missing Age:")
print(rows_missing_age)

# Rows missing EITHER Age OR City
rows_missing_either = df[df[['Age', 'City']].isnull().any(axis=1)]
print("\nRows missing Age or City:")
print(rows_missing_either)

# Rows missing BOTH Age AND City
rows_missing_both = df[df[['Age', 'City']].isnull().all(axis=1)]
print("\nRows missing both Age and City:")
print(rows_missing_both)
Target specific column combinations for conditional processing.
Create automated reports showing which columns/rows need cleaning before analysis starts.
Process different columns differently based on their missing data patterns and percentages.
Ensure critical columns (IDs, dates) have no missing values before proceeding with ETL pipeline.
Alert users which fields are incomplete in data entry forms or CSV uploads.
import pandas as pd
import numpy as np

def comprehensive_missing_analysis(df):
    """
    Complete analysis of missing values in DataFrame
    """
    print("=" * 60)
    print("COMPREHENSIVE MISSING VALUE DETECTION")
    print("=" * 60)

    # Overall statistics
    total_cells = df.shape[0] * df.shape[1]
    total_missing = df.isnull().sum().sum()
    pct_missing = (total_missing / total_cells) * 100

    print(f"\n📊 OVERALL STATISTICS")
    print(f"Total cells: {total_cells:,}")
    print(f"Total missing: {total_missing:,}")
    print(f"Percentage missing: {pct_missing:.2f}%")

    # Column analysis
    print(f"\n📋 COLUMN ANALYSIS")
    cols_with_missing = df.columns[df.isnull().any()].tolist()
    cols_complete = df.columns[df.notnull().all()].tolist()

    print(f"Columns with missing values: {len(cols_with_missing)}")
    print(f"Complete columns: {len(cols_complete)}")

    if cols_with_missing:
        print("\nMissing value breakdown by column:")
        missing_summary = df.isnull().sum()
        missing_summary = missing_summary[missing_summary > 0].sort_values(ascending=False)

        for col, count in missing_summary.items():
            pct = (count / len(df)) * 100
            print(f"  • {col}: {count} ({pct:.2f}%)")

    # Row analysis
    print(f"\n📝 ROW ANALYSIS")
    rows_with_missing = df.isnull().any(axis=1).sum()
    rows_complete = df.notnull().all(axis=1).sum()
    completely_empty = df.isnull().all(axis=1).sum()

    print(f"Rows with missing values: {rows_with_missing} ({(rows_with_missing/len(df)*100):.2f}%)")
    print(f"Complete rows: {rows_complete} ({(rows_complete/len(df)*100):.2f}%)")
    print(f"Completely empty rows: {completely_empty}")

    # Missing value distribution
    missing_per_row = df.isnull().sum(axis=1)
    print(f"\nMissing value distribution per row:")
    print(missing_per_row.value_counts().sort_index())

    # Critical columns check (example)
    critical_cols = ['Customer_ID', 'Order_Date', 'Amount']
    existing_critical = [col for col in critical_cols if col in df.columns]

    if existing_critical:
        print(f"\n⚠️  CRITICAL COLUMNS CHECK")
        for col in existing_critical:
            missing = df[col].isnull().sum()
            if missing > 0:
                print(f"  ⚠️  WARNING: {col} has {missing} missing values!")
            else:
                print(f"  ✓ {col} is complete")

    return {
        'columns_with_missing': cols_with_missing,
        'rows_with_missing': rows_with_missing,
        'total_missing': total_missing
    }

# Usage
results = comprehensive_missing_analysis(df)
print(f"\nColumns needing attention: {results['columns_with_missing']}")
df.isnull().sum().plot(kind='bar') for quick overviewdf.isnull().any(axis=0)
df.columns[df.isnull().any()].tolist()
df.isnull().sum()
df[df.isnull().any(axis=1)]
df[df.notnull().all(axis=1)]
df.isnull().any(axis=1).sum()
df[df.isnull().all(axis=1)]
df[df['ColumnName'].isnull()]
Next: Learn how to handle duplicate rows and ensure data uniqueness in your DataFrames.
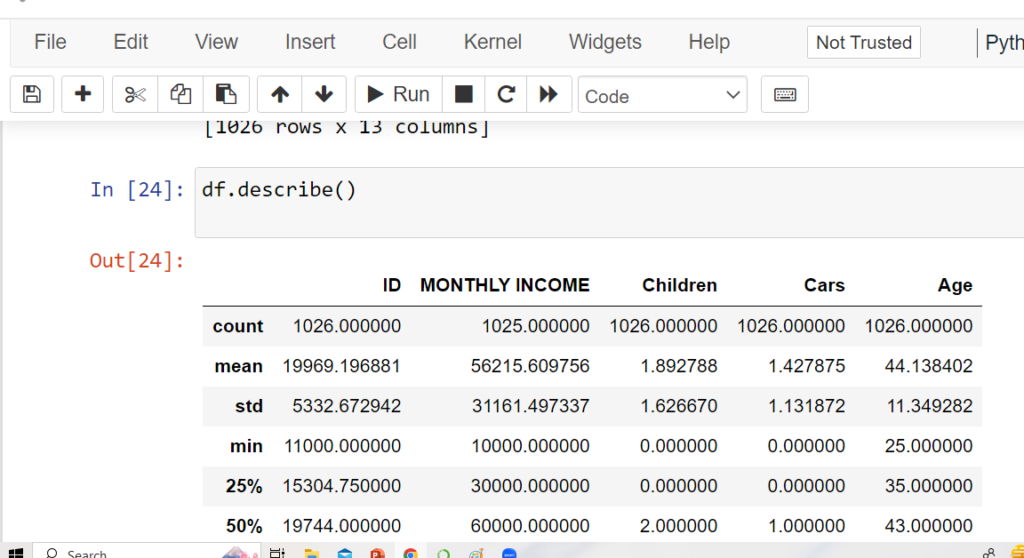
The describe() method summarizes numerical columns: count, mean, std, min,
25%, 50% (median), 75%, and max values.
Keywords: “pandas describe method”, “data cleaning python pandas”.
import pandas as pd

# Sample DataFrame
data = {'Age': [25, 30, 35, 40, 28],
        'Income': [40000, 50000, 60000, 75000, 48000]}
df = pd.DataFrame(data)

# Descriptive statistics
print(df.describe())
             Age        Income
count   5.000000      5.000000
mean   31.600000  54600.000000
std     6.429101  14031.787366
min    25.000000  40000.000000
25%    28.000000  48000.000000
50%    30.000000  50000.000000
75%    35.000000  60000.000000
max    40.000000  75000.000000
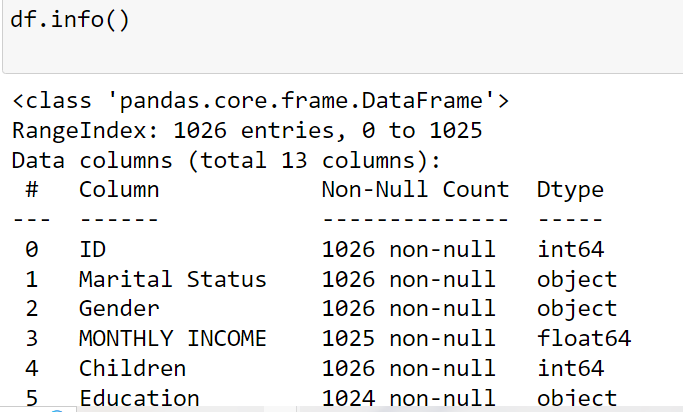
The info() method displays column names, data types, non-null counts,
and memory usage of a DataFrame.
Keywords: “df in python”, “what is df in python”, “python data cleansing”.
import pandas as pd

# Sample DataFrame
data = {'Name': ['Amit', 'Priya', 'Ravi'],
        'Age': [25, 30, None],
        'Country': ['India', 'USA', 'UK']}
df = pd.DataFrame(data)

# Get DataFrame info
df.info()
RangeIndex: 3 entries, 0 to 2
Data columns (total 3 columns):
 #   Column   Non-Null Count  Dtype
---  ------   --------------  -----
 0   Name     3 non-null      object
 1   Age      2 non-null      float64
 2   Country  3 non-null      object
dtypes: float64(1), object(2)
memory usage: 200.0+ bytes
Use fillna() to replace NaN values in different ways: constant values,
forward/backward fill, interpolation, mean/median, or custom logic.
Keywords: “fill missing values with median pandas”, “python pandas data cleaning”.
# Fill missing values with constant
df.fillna(0)
# Fill with previous value
df.fillna(method='ffill')
# Fill with interpolated values
df.interpolate()
# Fill missing values with mean
df.fillna(value=df.mean())
# Fill missing values with median
df.fillna(value=df.median())
# Fill using custom function
def my_func():
    return 99
df.fillna(value=my_func())
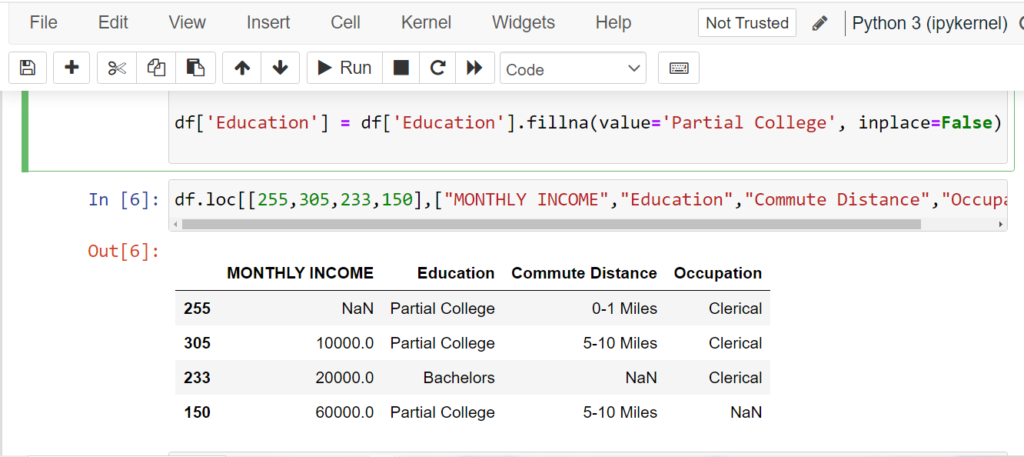
# Fill specific column
df['Education'] = df['Education'].fillna(value='Partial College', inplace=False)
Use dropna() to remove rows or columns with missing values in a DataFrame.
Keywords: “pandas data cleaning methods”, “data cleaning python pandas”.
# Drop rows with any NaN values
df.dropna()
# Drop rows where all values are NaN
df.dropna(how='all')
# Drop columns with NaN values
df.dropna(axis=1)
# Keep rows with at least 2 non-NaN values
df.dropna(thresh=2)
# Drop rows where 'Age' is NaN
df.dropna(subset=['Age'])
The replace() method is used to substitute specific values in a DataFrame or Series.
Keywords: “pandas data cleaning methods”, “python data cleansing”.
# Replace value 0 with NaN
import numpy as np
df.replace(0, np.nan)
# Replace multiple values
df.replace(['?', 'NA', 'missing'], np.nan)
# Replace using column-specific mapping
df.replace({'Gender': {'M': 'Male', 'F': 'Female'}})
# Replace text patterns using regex
df.replace(to_replace=r'^Unknown.*', value='Other', regex=True)
# Replace 0 in 'Income' column with column median
df['Income'].replace(0, df['Income'].median(), inplace=True)
Use duplicated() to detect duplicate rows and drop_duplicates() to remove them.
Keywords: “pandas data cleaning methods”, “python pandas data cleaning”.
# Find duplicate rows
df.duplicated()
# Count duplicate rows
df.duplicated().sum()
# Drop duplicate rows
df.drop_duplicates()
# Drop duplicates based on 'Name' column
df.drop_duplicates(subset=['Name'])
# Keep last occurrence, drop others
df.drop_duplicates(keep='last')
The apply() method lets you apply a custom function (or lambda)
to each element, row, or column in a DataFrame.
Keywords: “python data cleansing”, “data cleaning python pandas”.
# Convert all names to lowercase
df['Name'] = df['Name'].apply(lambda x: x.lower())
# Remove leading/trailing spaces
df['City'] = df['City'].apply(lambda x: x.strip())
# Replace negative values with 0
df['Income'] = df['Income'].apply(lambda x: max(x, 0))
# Create full_name by combining two columns
df['Full_Name'] = df.apply(lambda row: row['First'] + ' ' + row['Last'], axis=1)
# Define a custom function
def clean_age(x):
    return 0 if pd.isnull(x) else int(x)

df['Age'] = df['Age'].apply(clean_age)
Data cleaning, also known as data cleansing or data scrubbing, is the process of identifying and correcting or removing errors and inconsistencies in datasets to improve data quality and ensure it is suitable for analysis
Common data cleaning tasks include handling missing values, removing duplicates, correcting data types, standardizing formats, dealing with outliers, and handling inconsistencies in data.
Imputation is the process of filling in missing values with estimated or calculated values. You can use Pandas functions like fillna() or libraries like Scikit-Learn’s SimpleImputer for imputation.
You can handle missing values using libraries like Pandas by using functions like dropna() to remove rows with missing values, fillna() to fill missing values with a specified value, or by using techniques like interpolation or imputation.
You can remove duplicate rows in a Pandas DataFrame using the drop_duplicates() method.
Outliers are data points that deviate significantly from the rest of the data. You can detect and handle outliers using techniques such as Z-score, IQR (Interquartile Range), or visualization methods. Libraries like Scikit-Learn and Matplotlib can be helpful.