
Understanding Data Variation (Data Variation क्या है?)
Data Analytics में केवल Average जानना पर्याप्त नहीं होता। एक सफल Data Analyst को यह भी समझना होता है कि Data कितना बदल रहा है, कितना Stable है और भविष्य में उसका व्यवहार कैसा हो सकता है।
जब किसी Dataset की Values एक-दूसरे से अलग होती हैं, तो उसे Variation कहा जाता है। यही Variation हमें बताता है कि Data कितना Consistent, Predictable और Reliable है। इस अध्याय में हम Data Variation को आसान उदाहरणों और Business Cases की सहायता से समझेंगे।
🎯 इस अध्याय में आप सीखेंगे
✔ Data Variation क्या है?
✔ Data में Variation क्यों आता है?
✔ Low Variation vs High Variation
✔ Real-Life Examples
✔ Business Applications
✔ Standard Deviation से इसका संबंध

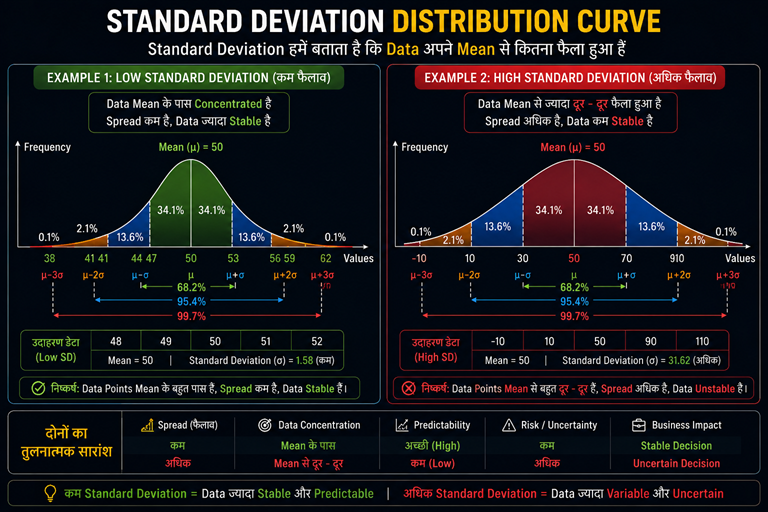
यदि सभी Values लगभग समान हैं, तो Data Stable माना जाता है और Variation कम होता है।
यदि Values में बहुत अधिक अंतर है, तो Data Unstable माना जाता है और Variation अधिक होता है।
उदाहरण के लिए यदि पाँच विद्यार्थियों के Marks
78, 79, 80, 81, 82
हैं, तो Variation बहुत कम है।
लेकिन यदि Marks
20, 45, 60, 85, 98
हैं, तो Variation काफी अधिक है।
Why Does Data Variation Occur?
Low Variation vs High Variation
- Data Mean के आसपास रहता है।
- Prediction आसान होती है।
- Business Risk कम होता है।
- Process अधिक Stable होता है।
- Quality बेहतर रहती है।
- Values Mean से काफी दूर होती हैं।
- Future Prediction कठिन होती है।
- Business Risk बढ़ जाता है।
- Process Unstable हो जाता है।
- Quality में असंगति दिखाई देती है।
💡 Remember
दो अलग-अलग Datasets का Mean समान हो सकता है लेकिन उनका Variation पूरी तरह अलग हो सकता है। यही कारण है कि केवल Average देखकर निर्णय लेना सही नहीं होता।
Variance Calculation (Variance कैसे Calculate करते हैं?)
70, 75, 80, 85, 90
अब हम Step-by-Step Variance निकालते हैं।
Step 1 : Mean (Average) निकालें
Mean = (70 + 75 + 80 + 85 + 90) ÷ 5
Mean = 400 ÷ 5 = 80
Step 2 : प्रत्येक Value में से Mean घटाएँ
70 − 80 = -10
75 − 80 = -5
80 − 80 = 0
85 − 80 = 5
90 − 80 = 10
Step 3 : सभी Differences का Square करें
(-10)² = 100
(-5)² = 25
(0)² = 0
(5)² = 25
(10)² = 100
Step 4 : सभी Squared Values जोड़ें
100 + 25 + 0 + 25 + 100 = 250
Step 5 : Variance निकालें
Variance = Total Squared Difference ÷ Number of Values
Variance = 250 ÷ 5
Variance = 50
💡 Easy Trick to Remember
Variance निकालने के केवल 5 Steps हैं:
✅ Mean निकालो
✅ Mean से Difference निकालो
✅ Difference का Square करो
✅ सभी Squares जोड़ो
✅ Total को Values की संख्या से Divide करो
Formula:
Variance = Σ (Value − Mean)² ÷ Number of Values
What is Standard Deviation? (Standard Deviation क्या है?)
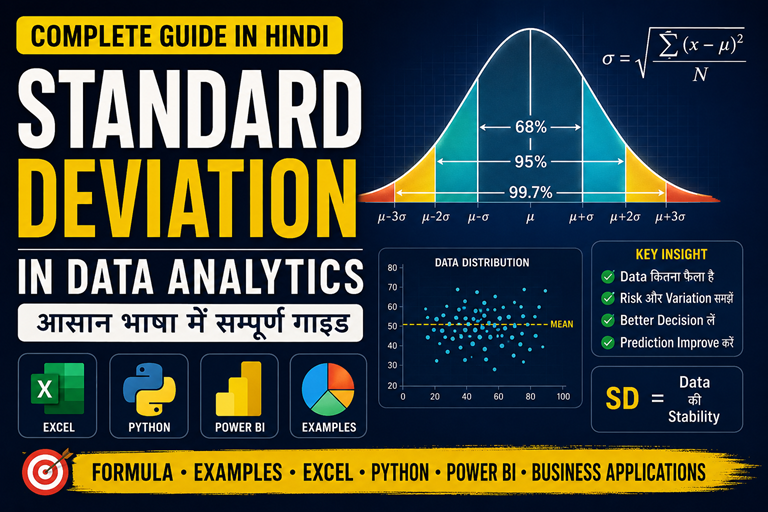
Standard Deviation Statistics का सबसे महत्वपूर्ण Measure है, जो हमें बताता है कि Data अपनी Average Value (Mean) से कितना दूर फैला हुआ है।
पिछले अध्याय में हमने Data Variation के बारे में सीखा था। अब प्रश्न यह है कि उस Variation को Number में कैसे मापा जाए?
इसका उत्तर है Standard Deviation (SD)।
यह एक Statistical Measure है जो बताता है कि Dataset की Values Mean के आसपास कितनी Close हैं या कितनी Spread हैं।
🎯 इस अध्याय में आप सीखेंगे
✔ Standard Deviation क्या है?
✔ इसकी सरल Definition
✔ Statistical Definition
✔ Business Definition
✔ Data Analytics में इसका महत्व
✔ Real-Life Examples

यदि अधिकांश Values Mean के पास हैं, तो Standard Deviation कम होगा।
यदि Values Mean से काफी दूर हैं, तो Standard Deviation अधिक होगा।
Standard Deviation बताता है कि Data कितना Stable है।
✔ कम SD = Data अधिक Consistent
✔ अधिक SD = Data अधिक Variable
जितना कम SD होगा, Business उतना अधिक Predictable होगा।
इसका उपयोग Data की Variability, Consistency और Reliability को Measure करने के लिए किया जाता है।
Why is Standard Deviation Important?
💡 Remember
Standard Deviation हमेशा 0 या उससे बड़ा होता है।
इसका मान कभी Negative नहीं हो सकता।
Why is Standard Deviation Important in Data Analytics?
Standard Deviation केवल एक Statistical Formula नहीं है, बल्कि यह Data Analyst के लिए सबसे महत्वपूर्ण Decision-Making Tools में से एक है।
यदि आपको केवल Average पता हो लेकिन यह न पता हो कि Data कितना Stable या Variable है, तो आपका Analysis अधूरा रहेगा। Standard Deviation हमें Data की Reliability, Consistency, Risk और Predictability को समझने में मदद करता है। यही कारण है कि Finance, Healthcare, Manufacturing, Marketing, Supply Chain, AI और Machine Learning जैसी Industries में इसका व्यापक उपयोग किया जाता है।
🎯 इस Chapter में आप सीखेंगे
✔ Standard Deviation क्यों महत्वपूर्ण है?
✔ Business Decision Making में इसका उपयोग
✔ Risk Analysis
✔ Forecasting और Prediction
✔ Machine Learning Applications
✔ Real Business Examples

Why Every Data Analyst Should Understand Standard Deviation
Real Business Applications
Benefits of Using Standard Deviation
💡 Key Insight
Mean हमें Data का Center बताता है, जबकि Standard Deviation बताता है कि Data उस Center के आसपास कितना फैला हुआ है। इसलिए दोनों को साथ में समझना आवश्यक है।
Mean vs Variance vs Standard Deviation
Data Analytics में किसी भी Dataset को समझने के लिए केवल एक Statistical Measure पर्याप्त नहीं होता। एक Data Analyst को Data का Center (Mean) और Data का Spread (Variance एवं Standard Deviation) दोनों समझने होते हैं।
अब तक आपने Standard Deviation के बारे में विस्तार से पढ़ा। लेकिन वास्तव में Standard Deviation को पूरी तरह समझने के लिए पहले Mean और Variance की समझ होना आवश्यक है।
इस Chapter में हम इन तीनों Statistical Measures की तुलना करेंगे, उनके बीच का संबंध समझेंगे और जानेंगे कि Business Analytics, Data Science तथा Machine Learning में कब किसका उपयोग किया जाता है।
🎯 इस Chapter में आप सीखेंगे
✔ Mean क्या है?
✔ Variance क्या है?
✔ Standard Deviation क्या है?
✔ तीनों के बीच संबंध
✔ Real-Life Examples
✔ Business Applications
✔ Interview Questions

📊 What is Mean?
जब हम किसी Dataset की सभी Values को जोड़कर Total Number of Observations से Divide करते हैं, तो प्राप्त Value को Mean कहते हैं।
यह Statistics का सबसे Basic तथा सबसे अधिक उपयोग किया जाने वाला Measure है।
Data Analytics में Mean हमें यह समझने में सहायता करता है कि Data का सामान्य (Typical) या Average Behaviour क्या है।
यदि किसी Dataset में 10,000 Observations हों, तो Mean पूरे Dataset को एक Representative Value में बदल देता है।
✔ Company Sales
✔ Customer Rating
✔ Employee Salary
✔ Hospital Reports
✔ Machine Learning
🧮 Formula of Mean

Mean = (Sum of All Values) ÷ (Number of Values)
उदाहरण
Marks = 70, 75, 80, 85, 90
Total = 400
Observations = 5
Mean = 400 ÷ 5 = 80
🎓 Real-Life Example
- 70
- 75
- 80
- 85
- 90
अब Teacher को पता चल गया कि Student का Overall Performance लगभग 80 Marks के आसपास है।
- ₹45,000
- ₹50,000
- ₹55,000
- ₹48,000
- ₹52,000
Business Owner Mean देखकर Overall Performance समझ सकता है।
💡 Important Note
Mean केवल Average बताता है।
यह यह नहीं बताता कि Data कितना Stable है या कितना फैला हुआ है।
इसी Limit को दूर करने के लिए अगले Section में हम Variance को समझेंगे।
What is Variance? (Variance क्या है?)
Mean हमें केवल Average बताता है, लेकिन यह नहीं बताता कि Data कितना फैला हुआ (Spread) है। इसी समस्या को हल करने के लिए Statistics में Variance का उपयोग किया जाता है।
Variance एक Statistical Measure है जो बताता है कि Dataset की प्रत्येक Value Mean से औसतन कितनी दूर है। यह Data की Variability या Dispersion को मापने का पहला Mathematical Measure है और Standard Deviation का आधार भी है।
🎯 इस Block में आप सीखेंगे
✔ Variance क्या है?
✔ Variance की आवश्यकता क्यों पड़ी?
✔ Variance Formula
✔ Square क्यों किया जाता है?
✔ Business Example
✔ Variance की Limitations
📊 Definition of Variance
यदि अधिकांश Values Mean के आसपास हैं, तो Variance कम होगा।
यदि Values Mean से बहुत दूर-दूर हैं, तो Variance अधिक होगा।
दूसरे शब्दों में, Variance = Average of Squared Deviations from the Mean
❓ Why Do We Need Variance?
इसलिए केवल Mean देखकर सही निर्णय लेना संभव नहीं है।
यही कारण है कि इसे Standard Deviation का आधार माना जाता है।
🧮 Variance Formula

Variance निकालने के Steps
- Mean निकालें
- हर Value से Mean घटाएँ
- Difference का Square करें
- सभी Squared Values जोड़ें
- Population Size से Divide करें
🤔 Why Do We Square the Deviations?
🏢 Business Example
Variance बहुत कम है। Sales Stable हैं।
Variance बहुत अधिक है। Business Predict करना कठिन होगा।
⚠ Limitations of Variance
💡 Remember
Variance Data के Spread को Measure करता है,
लेकिन उसकी Unit Square में होने के कारण उसे समझना कठिन होता है।
इसी समस्या को हल करने के लिए Standard Deviation का उपयोग किया जाता है।
What is Standard Deviation?
अब आपने Mean और Variance दोनों को समझ लिया है। लेकिन एक महत्वपूर्ण प्रश्न अभी भी बचता है— यदि Variance Data का Spread बताता है, तो फिर Standard Deviation की आवश्यकता क्यों पड़ी?
Variance Data की Variability को Measure करता है, लेकिन उसकी सबसे बड़ी समस्या यह है कि उसकी Unit हमेशा Square में होती है। इसी समस्या को हल करने के लिए Variance का Square Root लिया जाता है, जिसे Standard Deviation (SD) कहते हैं।
Standard Deviation Data की Variability को Original Unit में व्यक्त करता है, इसलिए इसे समझना और Business Decision Making में उपयोग करना कहीं अधिक आसान होता है।
🎯 इस Block में आप सीखेंगे
✔ Standard Deviation क्या है?
✔ Standard Deviation की Formula
✔ Variance और SD में अंतर
✔ SD क्यों अधिक लोकप्रिय है?
✔ Business Interpretation
📊 Definition of Standard Deviation
यदि अधिकांश Values Mean के आसपास हैं, तो Standard Deviation कम होगा।
यदि Values Mean से बहुत दूर हैं, तो Standard Deviation अधिक होगा।
Standard Deviation = √Variance
🧮 Standard Deviation Formula

Standard Deviation निकालने के Steps
- Mean Calculate करें
- Deviation निकालें
- Deviation का Square करें
- Variance Calculate करें
- Variance का Square Root लें
🚀 Why Standard Deviation is Better than Variance?
इसी कारण इसकी Interpretation आसान होती है।
🏢 Business Example
Average = 500 ml
Standard Deviation = 1 ml
यह दर्शाता है कि Machine बहुत Stable है।
Stock A का SD = 3%
Stock B का SD = 18%
Stock B अधिक Volatile और Risky माना जाएगा।
📋 Mean vs Variance vs Standard Deviation
💡 Key Insight
Mean हमें Data का Center बताता है।
Variance Data के Spread को Square Units में बताता है।
Standard Deviation वही Spread Original Units में बताता है,
इसलिए यह सबसे अधिक उपयोग किया जाने वाला Measure है।
Understanding the Standard Deviation Formula
अब तक आपने Mean, Variance और Standard Deviation का Concept समझ लिया है। अब समय है यह जानने का कि वास्तव में Standard Deviation Calculate कैसे किया जाता है? — और साथ ही यह भी कि इसके लिए दो अलग Formula (Population और Sample) क्यों उपयोग होते हैं।
बहुत से Students Formula देखकर घबरा जाते हैं, लेकिन वास्तव में Standard Deviation Formula केवल कुछ आसान Steps का Combination है।
यदि आप Mean निकालना जानते हैं, तो Standard Deviation सीखना भी आसान है। इस पूरे Chapter में हम एक ही साथ समझेंगे — Formula के पीछे का Logic, सभी Symbols, Population Formula, Sample Formula, और दोनों के Full Calculation Examples।
🎯 इस Chapter में आप सीखेंगे
✔ Standard Deviation Formula की आवश्यकता और Workflow
✔ Population Standard Deviation Formula (σ) — Calculation सहित
✔ Sample Standard Deviation Formula (s) — Calculation सहित
✔ n−1 (Bessel’s Correction) क्यों उपयोग होता है?
✔ Population vs Sample — कब कौन-सा Formula उपयोग करें?

🤔 Why Do We Need a Formula?
Data Analysts, Researchers और Businesses को एक ऐसी Numerical Value चाहिए जो यह बताए कि Data Mean से औसतन कितना दूर फैला हुआ है। यही काम Standard Deviation Formula करता है — यह किसी भी Dataset की Variability को एक Single Number में बदल देता है, जिससे Decision Making आसान हो जाती है।
📊 How Does the Formula Work?
⬇
Calculate Mean
⬇
Find Deviations
⬇
Square Every Deviation
⬇
Calculate Variance (÷N या ÷n−1)
⬇
Take Square Root
⬇
Standard Deviation
🌍 Population Standard Deviation Formula (σ)
जब आपके पास इस पूरे Group का Complete Data उपलब्ध हो, तभी Population Formula (σ) का उपयोग किया जाता है।

σ = √[ Σ(x − μ)² / N ]
Step 1: Population Mean (μ)
μ = (30,000 + 35,000 + 40,000 + 45,000 + 50,000) ÷ 5 = 2,00,000 ÷ 5 = ₹40,000
Step 2 & 3: Deviation और Square
Step 4: Variance
Total Squared Deviations = 25,00,00,000
Variance (σ²) = 25,00,00,000 ÷ 5 = 50,00,000
Step 5: Standard Deviation
σ = √50,00,000 ≈ ₹7,071
Interpretation
Average Salary ₹40,000 है, और ज़्यादातर Employees की Salary इस Average से लगभग ₹7,071 ऊपर या नीचे है। चूँकि यहाँ Company के सभी Employees का Data मौजूद है (कोई भी बाहर नहीं है), इसलिए N से Divide करना सही है — यही Population Formula का मूल Rule है।
📖 Sample Standard Deviation Formula (s)
- 10 लाख Customers में से 2,000 Customers का Survey
- पूरे राज्य की जगह 20 Schools का अध्ययन
- सभी Employees की जगह 100 Employees का Performance Analysis

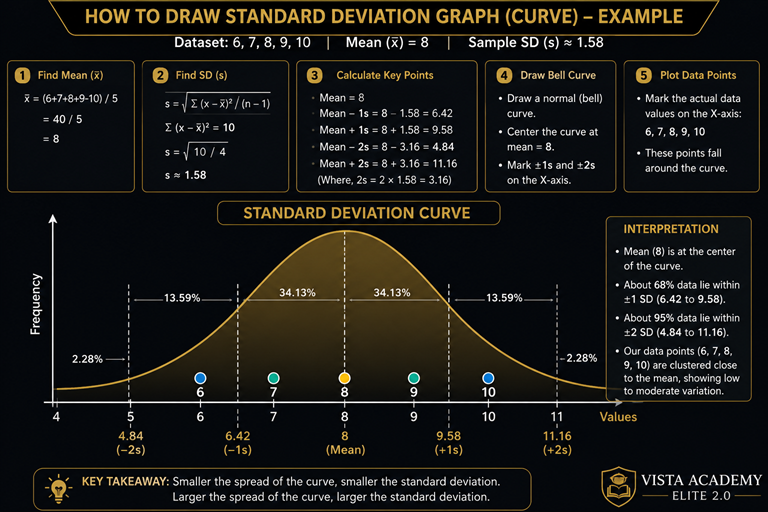
s = √[ Σ(x − x̄)² / (n − 1) ]
🤔 Why Do We Divide by (n − 1)?
Customer Satisfaction Ratings (Out of 10):
Step 1: Sample Mean (x̄)
x̄ = (6 + 7 + 8 + 9 + 10) ÷ 5 = 8
Step 2 & 3: Deviation और Square
Step 4: Sample Variance
Total Squared Deviations = 10
Sample Variance = 10 ÷ (5 − 1) = 2.5
Step 5: Sample Standard Deviation
s = √2.5 ≈ 1.58
Interpretation
इस Sample का Average Rating 8 है, और Standard Deviation लगभग 1.58 है — यानी अधिकांश Customer Ratings Average से लगभग 1.58 Points के भीतर हैं। अगर SD सिर्फ 0.3 होता, तो लगभग सभी Customers की Ratings एक जैसी होतीं; अगर SD 4 या 5 होता, तो Customer Satisfaction में बहुत अधिक Variation होता।
Companies इसी तरह पूरी Population का Survey किए बिना, एक Representative Sample के आधार पर पूरी Population के बारे में निर्णय लेती हैं — इसीलिए Market Research, Customer Surveys, Opinion Polls और Healthcare Research में Sample Standard Deviation Formula सबसे ज़्यादा उपयोग होता है।
📌 Population vs Sample — Quick Difference
💡 Interview Tip
यदि Interview में पूछा जाए — “Why do we divide by n−1 instead of n?”
तो उत्तर दें:
“Using n−1 (Bessel’s Correction) provides an unbiased estimate of the population variance when working with sample data.”
💡 Remember
Standard Deviation का Formula याद करने से अधिक महत्वपूर्ण है यह समझना कि हर Step क्यों किया जाता है, और Data Population है या Sample — यह पहचानना, क्योंकि यही तय करता है कि N से Divide करें या n−1 से।
Understanding the Normal Distribution (Bell Curve)
अब तक हमने Standard Deviation की पूरी Calculation सीखी। लेकिन केवल Standard Deviation निकालना पर्याप्त नहीं है। एक Data Analyst को यह भी समझना होता है कि उस Standard Deviation का वास्तविक अर्थ क्या है।
यहीं से शुरू होती है Normal Distribution की कहानी।
Normal Distribution हमें दिखाती है कि Data Mean के आसपास किस प्रकार फैला हुआ है। यही कारण है कि Data Science, Machine Learning, Statistics, Artificial Intelligence और Business Analytics में Bell Curve सबसे महत्वपूर्ण Graph माना जाता है।
🎯 इस Chapter में आप सीखेंगे
✔ Normal Distribution क्या है?
✔ इसे Bell Curve क्यों कहते हैं?
✔ Data Analysts इसका उपयोग क्यों करते हैं?
✔ Real-Life Examples
✔ Business Applications

📖 What is Normal Distribution?
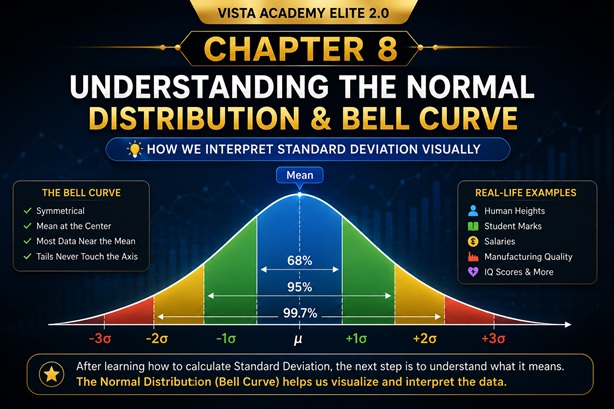
इस Distribution का Graph घंटी (Bell) के आकार का दिखाई देता है, इसलिए इसे Bell Curve भी कहा जाता है।
इसकी सबसे महत्वपूर्ण विशेषता यह है कि यह पूरी तरह Symmetrical (सममित) होता है अर्थात Mean के दोनों ओर Data लगभग समान रूप से फैला होता है।
📈 Visual Representation
Interactive Bell Curve showing how data is distributed around the Mean (μ).
🔔 Why is it Called a Bell Curve?
💼 Why Do Data Analysts Use Normal Distribution?
🌍 Real-Life Examples of Normal Distribution
💡 Did You Know?
Normal Distribution Statistics की सबसे प्रसिद्ध Probability Distribution है।
इसी Distribution के आधार पर Standard Deviation, Z-Score, Hypothesis Testing, Machine Learning, Artificial Intelligence और Predictive Analytics जैसे अनेक Advanced Concepts विकसित किए गए हैं।
Understanding Mean & Standard Deviation on the Bell Curve
Bell Curve को समझने के लिए दो सबसे महत्वपूर्ण Concepts हैं — Mean (μ) और Standard Deviation (σ)। Mean हमें Distribution का Center बताता है, जबकि Standard Deviation यह बताता है कि Data Mean से कितना फैला हुआ है।
यदि Standard Deviation छोटा है, तो Bell Curve पतली (Narrow) होगी क्योंकि अधिकांश Values Mean के पास होंगी। यदि Standard Deviation बड़ा है, तो Bell Curve चौड़ी (Wide) होगी क्योंकि Values Mean से अधिक दूर फैली होंगी।
🎯 इस Block में आप सीखेंगे
✔ Mean (μ) क्या दर्शाता है?
✔ Standard Deviation (σ) क्या दर्शाता है?
✔ ±1σ, ±2σ और ±3σ
✔ Bell Curve को कैसे पढ़ें?

📊 Mean and Standard Deviation Visualization
The center of the Bell Curve represents the Mean (μ), while the spread on both sides is measured using Standard Deviation (σ).
🎯 What Does the Mean Represent?
यही वह Point है जहाँ अधिकांश Data Concentrate होता है।
यदि Students के Marks का Mean 80 है, तो अधिकांश Students के Marks लगभग 80 के आसपास होंगे।
📏 What Does Standard Deviation Represent?
• छोटा σ → Data Mean के पास है।
• बड़ा σ → Data Mean से दूर फैला हुआ है।
यही कारण है कि Standard Deviation Data Consistency का सबसे लोकप्रिय Measure माना जाता है।
📍 Understanding ±1σ, ±2σ and ±3σ
यहीं सबसे अधिक Data मौजूद होता है।
लगभग पूरा Data इस Range के भीतर आ जाता है।
इससे बाहर की Values बहुत दुर्लभ (Rare) होती हैं।
📈 Reading the Bell Curve
💼 Business Example
और Standard Deviation ₹50,000 है, तो अधिकांश महीनों की Sales ₹9.5 लाख से ₹10.5 लाख के बीच रहने की संभावना होगी।
लेकिन यदि Standard Deviation ₹3,00,000 हो, तो Sales में काफी उतार-चढ़ाव होगा और Business Risk बढ़ जाएगा।
🧠 Key Observations
High Consistency
Better Prediction
High Variation
Higher Risk
💡 Remember
Mean हमेशा Bell Curve के Center पर होता है।
Standard Deviation यह तय करता है कि Bell Curve कितनी Narrow या कितनी Wide होगी।
The 68–95–99.7 Rule (Empirical Rule)
Normal Distribution की सबसे महत्वपूर्ण विशेषताओं में से एक है 68–95–99.7 Rule। इस Rule की सहायता से हम केवल Mean और Standard Deviation जानकर यह अनुमान लगा सकते हैं कि अधिकांश Data किस Range में मौजूद होगा।
Data Analytics, Machine Learning, Six Sigma, Finance और Manufacturing में यह Rule Data Distribution को जल्दी समझने और Outliers की पहचान करने के लिए उपयोग किया जाता है।
🎯 इस Block में आप सीखेंगे
✔ 68% Rule
✔ 95% Rule
✔ 99.7% Rule
✔ Empirical Rule
✔ Real-Life Example

📊 Normal Distribution Intervals
The shaded regions show how the percentage of observations increases as we move from ±1σ to ±3σ around the mean.
📌 What is the 68–95–99.7 Rule?
✅ लगभग 68% Data Mean से ±1 Standard Deviation के भीतर होता है।
✅ लगभग 95% Data Mean से ±2 Standard Deviations के भीतर होता है।
✅ लगभग 99.7% Data Mean से ±3 Standard Deviations के भीतर होता है।
📋 Percentage Summary
🎓 Student Marks Example
Mean Marks = 80
Standard Deviation = 5
तो—
68% Students की Marks लगभग 75 से 85 के बीच होंगी।
95% Students की Marks लगभग 70 से 90 के बीच होंगी।
99.7% Students की Marks लगभग 65 से 95 के बीच होंगी।
💼 Business Example
🚨 What Are Outliers?
ये Rare Events हो सकते हैं और कई बार Fraud Detection, Machine Failure, Medical Diagnosis तथा Financial Risk Analysis में विशेष महत्व रखते हैं।
💡 Interview Tip
यदि Interview में पूछा जाए—
“What is the 68–95–99.7 Rule?”
तो उत्तर दें—
“It is an empirical rule stating that in a normal distribution approximately 68% of observations lie within one standard deviation, 95% within two, and 99.7% within three standard deviations from the mean.”
Low Standard Deviation vs High Standard Deviation
अब तक हमने Bell Curve और 68–95–99.7 Rule को समझ लिया। लेकिन एक महत्वपूर्ण प्रश्न अभी भी बाकी है— यदि Standard Deviation छोटा या बड़ा हो तो Bell Curve में क्या परिवर्तन होता है?
Standard Deviation केवल एक Number नहीं है। यह Bell Curve की चौड़ाई (Width), Data की Consistency, Prediction Accuracy और Business Risk को दर्शाता है।
यही कारण है कि Data Analysts सबसे पहले Standard Deviation देखकर Data की Stability का अनुमान लगाते हैं।
🎯 इस Block में आप सीखेंगे
✔ Low Standard Deviation
✔ High Standard Deviation
✔ Narrow vs Wide Bell Curve
✔ Business Interpretation
✔ Real-Life Examples

📊 Visual Comparison
Curve B → Wide Bell Curve → High Standard Deviation
दोनों Curves का Mean समान हो सकता है, लेकिन उनका Spread अलग-अलग होगा।
🟢 Low Standard Deviation
🔴 High Standard Deviation
📋 Comparison Table
🎓 Student Marks Example
Mean लगभग 80
Standard Deviation बहुत कम
सभी Students लगभग समान प्रदर्शन कर रहे हैं।
Mean लगभग समान हो सकता है, लेकिन Standard Deviation बहुत अधिक होगा।
Students की Performance में बहुत बड़ा अंतर है।
💼 Business Examples
High SD = Volatile Investment
High SD = Demand Uncertain
High SD = Further Investigation Required
💡 Key Insight
Mean समान होने पर भी दो Datasets की Standard Deviation पूरी तरह अलग हो सकती है।
इसीलिए Data Analysis में केवल Mean देखना पर्याप्त नहीं होता।
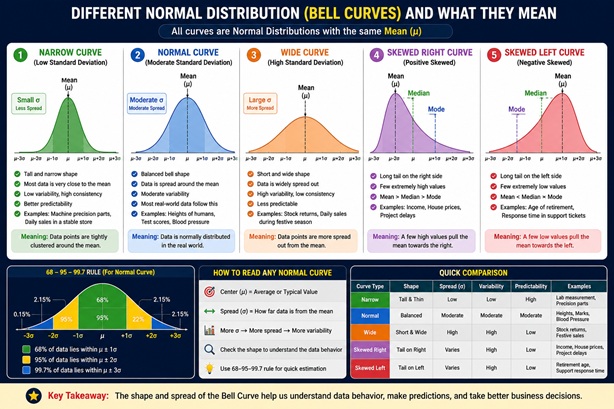
How Do You Know If Your Data is Normally Distributed?
अब आपने Bell Curve, Standard Deviation और विभिन्न प्रकार की Distribution Curves को समझ लिया है। लेकिन वास्तविक Data Analytics Project में सबसे महत्वपूर्ण प्रश्न होता है—
🤔 “क्या मेरा Dataset वास्तव में Normal Distribution को Follow करता है?”
यह प्रश्न प्रत्येक Data Analyst, Data Scientist और Machine Learning Engineer को पूछना चाहिए।
क्योंकि Statistics और Machine Learning की कई Techniques यह मानकर चलती हैं कि Data लगभग Normally Distributed है।
यदि आपका Data Normal नहीं है, तो कई Statistical Tests, Predictive Models और Business Decisions गलत हो सकते हैं।

🎯 Why Should We Check Normal Distribution?
📋 Characteristics of Normally Distributed Data
📊 Interactive Bell Curve
Observe how most observations remain close to the Mean while only a small percentage falls toward the tails of the Bell Curve.
🏢 Real-Life Examples
🚫 When Data is NOT Normally Distributed
💡 Important Tip
किसी Dataset को देखकर यह अनुमान लगाना पर्याप्त नहीं है कि वह Normal है।
एक Professional Data Analyst हमेशा Visual Charts और Statistical Tests दोनों का उपयोग करके Normality Verify करता है।
Standard Deviation in Excel, Python, SQL & Power BI
अब तक आपने Standard Deviation की Theory, Formula, Manual Calculation और Normal Distribution को विस्तार से समझ लिया है।
लेकिन Professional Data Analyst केवल Formula याद नहीं रखते—वे इसे विभिन्न Analytics Tools में लागू (Implement) भी करते हैं।
आज लगभग हर Data Analytics Project में Excel, SQL, Python और Power BI का उपयोग किया जाता है। अच्छी बात यह है कि Standard Deviation का Concept सभी Tools में समान रहता है, केवल Syntax और Implementation बदलती है।
यदि आप Data Analyst या Data Scientist बनना चाहते हैं, तो आपको इन सभी Tools में Standard Deviation निकालना आना चाहिए।
🎯 इस Chapter में आप सीखेंगे
✔ Excel में Standard Deviation
✔ Python (NumPy & Pandas)
✔ SQL Queries
✔ Power BI DAX Functions
✔ Tool Comparison
✔ Real Business Examples

🚀 Why Do We Learn Multiple Tools?
Quick Reports, Business Dashboards और Basic Analysis के लिए आदर्श।
💼 Which Tool is Used Where?
📊 One Concept, Different Syntax
Standard Deviation हमेशा Data के Spread (Variability) को ही मापता है।
अंतर केवल Function के नाम, Syntax और Implementation का होता है।
🏢 Real Business Workflow
🎯 Skills Companies Expect
💡 Career Tip
एक सफल Data Analyst केवल Statistics नहीं जानता, बल्कि वही Statistical Concepts विभिन्न Analytics Tools में लागू (Implement) करना भी जानता है।
यही Skill आपको Job-Ready बनाती है।
How to Calculate Standard Deviation in Microsoft Excel
Microsoft Excel Data Analytics की दुनिया का सबसे लोकप्रिय Tool है। चाहे Sales Report हो, Employee Performance Analysis, Financial Data या Student Results—Excel में Standard Deviation निकालना केवल एक Formula का काम है।
Excel दो मुख्य Functions प्रदान करता है—
STDEV.S() → Sample Data के लिए
STDEV.P() → Population Data के लिए
सही Function चुनना अत्यंत महत्वपूर्ण है क्योंकि गलत Function आपके Statistical Analysis को प्रभावित कर सकता है।
🎯 इस Block में आप सीखेंगे
✔ STDEV.S Function
✔ STDEV.P Function
✔ Excel Formula
✔ Step-by-Step Example
✔ Common Mistakes
✔ Business Applications

📊 Sample Dataset
| Month | Sales (₹) |
|---|---|
| January | 42000 |
| February | 45000 |
| March | 47000 |
| April | 44000 |
| May | 46000 |
🟢 STDEV.S Function
=STDEV.S(B2:B6)
यह Function तब उपयोग किया जाता है जब आपके पास Population का केवल Sample Data हो।
Data Analytics, Surveys, Market Research और अधिकांश Business Reports में यही Function सबसे अधिक उपयोग होता है।
🔵 STDEV.P Function
=STDEV.P(B2:B6)
यह Function तब उपयोग किया जाता है जब आपके पास पूरी Population का Data उपलब्ध हो।
जैसे—
- पूरे School के सभी Students
- पूरे Factory के सभी Products
- Company के सभी Employees
📋 STDEV.S vs STDEV.P
💼 Real Business Example
Manager केवल Average Sales नहीं देखता बल्कि यह भी जानना चाहता है कि Sales कितनी Stable हैं।
यदि Standard Deviation कम है—
✔ Sales Consistent हैं।
✔ Demand Predict करना आसान है।
यदि Standard Deviation अधिक है—
⚠ Sales में अधिक उतार-चढ़ाव है।
⚠ Inventory Planning और Budgeting कठिन हो सकती है।
❌ Common Mistakes
🎯 Interview Questions
What is the difference between STDEV.S and STDEV.P?
Which Excel Function is mostly used in Data Analytics?
Calculate Standard Deviation in Python using NumPy & Pandas
Python आधुनिक Data Analytics, Data Science और Machine Learning की सबसे लोकप्रिय Programming Language है। जब Dataset लाखों Records का हो, तब Manual Calculation या Excel पर्याप्त नहीं होता। ऐसे में Python की Libraries जैसे NumPy और Pandas कुछ सेकंड में Standard Deviation निकाल सकती हैं।
NumPy और Pandas दोनों Standard Deviation की Calculation करते हैं, लेकिन उनका Default Behavior अलग हो सकता है। इसलिए Data Analyst को Population और Sample Standard Deviation के बीच का अंतर समझना आवश्यक है।
🎯 इस Block में आप सीखेंगे
✔ NumPy std()
✔ Pandas std()
✔ Population vs Sample
✔ Python Code
✔ Business Example
✔ Common Mistakes

📊 Sample Dataset
[42000, 45000, 47000, 44000, 46000]
अब हम इसी Dataset का Standard Deviation Python में निकालेंगे।
🐍 NumPy Example
import numpy as np

sales = [42000,45000,47000,44000,46000]

np.std(sales)
ऊपर दिया गया Function Default रूप से Population Standard Deviation (ddof = 0) Calculate करता है।
🐼 Pandas Example
import pandas as pd

df = pd.DataFrame({
    "Sales":[42000,45000,47000,44000,46000]
})

df["Sales"].std()
Pandas का .std() Function Default रूप से Sample Standard Deviation (ddof = 1) Calculate करता है।
⚙ Population vs Sample in Python
np.std(data)✔ Population
✔ ddof = 0
np.std(data, ddof=1)✔ Sample Standard Deviation
df["Sales"].std()✔ Sample
✔ ddof = 1
df["Sales"].std(ddof=0)✔ Population SD
📋 Quick Comparison
💼 Business Example
Python की सहायता से Data Analyst कुछ सेकंड में यह पता लगा सकता है कि—
- Daily Sales कितनी Stable हैं।
- कौन से Products में सबसे अधिक Variation है।
- किस Region की Sales सबसे अधिक Consistent है।
- कहाँ Outliers मौजूद हैं।
❌ Common Mistakes
🎯 Interview Questions
What is the difference between NumPy std() and Pandas std()?
Why is ddof important?
Calculate Standard Deviation in SQL
जब Data लाखों या करोड़ों Records में Database के अंदर Store होता है, तब उसे Excel में Export करना व्यावहारिक नहीं होता। ऐसी स्थिति में SQL का उपयोग करके Database के अंदर ही Standard Deviation Calculate किया जाता है।
SQL Server, PostgreSQL, Oracle और कई अन्य Databases Standard Deviation के लिए Built-in Statistical Functions प्रदान करते हैं। Data Analyst अक्सर Department-wise Salary Analysis, Product Quality, Sales Performance और Customer Behaviour का Analysis SQL की सहायता से करते हैं।
🎯 इस Block में आप सीखेंगे
✔ STDEV() Function
✔ STDEVP() Function
✔ GROUP BY Example
✔ Business SQL Queries
✔ Interview Questions

🗄 Sample Employee Table
| Employee_ID | Department | Salary |
|---|---|---|
| 101 | Sales | 45000 |
| 102 | Sales | 47000 |
| 103 | Sales | 43000 |
| 104 | Sales | 49000 |
| 105 | Sales | 46000 |
📊 Calculate Sample Standard Deviation
SELECT
    STDEV(Salary) AS Sample_SD
FROM Employee_Salary;
यह Query Sample Standard Deviation Calculate करती है।
अधिकांश Business Reports और Data Analytics Projects में इसी Function का उपयोग किया जाता है।
📈 Calculate Population Standard Deviation
SELECT
    STDEVP(Salary) AS Population_SD
FROM Employee_Salary;
यदि Table में पूरी Population उपलब्ध है, तो Population Standard Deviation उपयोग किया जाता है।
🏢 Department-wise Standard Deviation
SELECT
    Department,
    AVG(Salary) AS Average_Salary,
    STDEV(Salary) AS Salary_SD
FROM Employee_Salary
GROUP BY Department;
यह Query प्रत्येक Department की Average Salary तथा Salary Variation दिखाती है।
💼 Real Business Use Cases
📋 SQL Functions Comparison
⚠ Common Mistakes
🎯 Interview Questions
What is the difference between STDEV() and STDEVP()?
Why is GROUP BY used with STDEV()?
Calculate Standard Deviation in Power BI using DAX
Power BI केवल Charts बनाने का Tool नहीं है। यह एक शक्तिशाली Business Intelligence Platform है, जहाँ आप DAX (Data Analysis Expressions) का उपयोग करके Standard Deviation जैसी Statistical Calculations कर सकते हैं।
Power BI में Standard Deviation की मदद से आप Sales Stability, Employee Performance, Manufacturing Quality, Customer Spending और Financial Risk जैसे Business Metrics को Interactive Dashboards के माध्यम से Analyze कर सकते हैं।
🎯 इस Block में आप सीखेंगे
✔ STDEV.S()
✔ STDEV.P()
✔ DAX Measures
✔ KPI Dashboard
✔ Business Applications
✔ Interview Questions

📊 Sample Sales Table
| Month | Sales |
|---|---|
| January | 42000 |
| February | 45000 |
| March | 47000 |
| April | 44000 |
| May | 46000 |
📈 STDEV.S Measure
Sales SD =
STDEV.S(Sales[Sales])
यह Measure Sample Dataset के लिए Standard Deviation Calculate करता है। Business Analytics Projects में यही Function सबसे अधिक उपयोग किया जाता है।
📉 STDEV.P Measure
Sales SD Population =
STDEV.P(Sales[Sales])
यदि Dataset पूरी Population को Represent करता है, तो STDEV.P() Function उपयोग करें।
📋 KPI Dashboard Example
💼 Real Business Applications
📊 Complete Analytics Workflow
Step 2 → Clean & Transform Data using Power Query
Step 3 → Create DAX Measures
Step 4 → Calculate Standard Deviation
Step 5 → Build KPI Cards & Charts
Step 6 → Publish Interactive Dashboard
🎯 Power BI Interview Questions
Which DAX Function calculates Sample Standard Deviation?
When should you use STDEV.P()?
Why is Standard Deviation useful in Power BI Dashboards?
🏆 Tool Comparison
💡 Career Tip
यदि आप Data Analyst बनना चाहते हैं, तो केवल Formula याद करना पर्याप्त नहीं है।
Excel, SQL, Python और Power BI में Standard Deviation का Practical उपयोग सीखना आपको Industry-Ready बनाता है।