20 DAX function in Power Bi to get insight
Microsoft power bi is great tool to find insight from data. Here we discuss 20 types of questions to find insight from data .We use Power bi Data analytics expression to solve these questions one by one.
First of all we have to import data in power bi and then find useful answer of the questions
Table of Contents
ToggleDataset link

Download the dataset in your computer and import the file in the Power bi
How much sales was made in total from all orders?
Using the DAX formula shown below, you can determine the total sales revenue:
note : Sales Performance is the name of the table
Total Sales Revenue = SUM('Sales Performance'[Sales Revenue]) 
What Number of the dataset's sales agents are unique?
Answer: You can use the DAX method shown below to determine the precise number of distinct sales representatives:
Unique Sales Representatives = DISTINCTCOUNT('Sales Performance'[Sales Representative]) 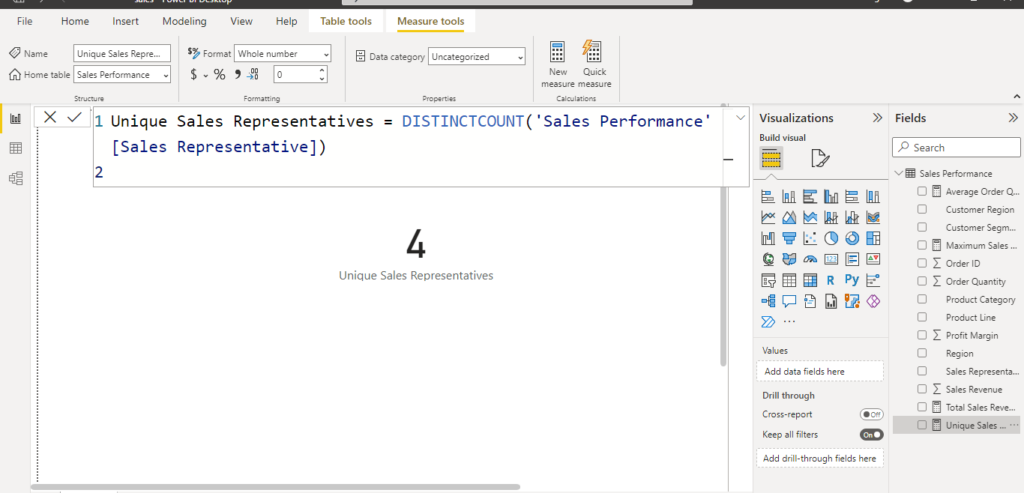
What is the average order quantity for the Electronics product category?
To calculate the average order quantity for the Electronics product category, you can use the following DAX formula:
Average Order Quantity = AVERAGEX(FILTER('Sales Performance', 'Sales Performance'[Product Category] = "Electronics"), 'Sales Performance'[Order Quantity]) 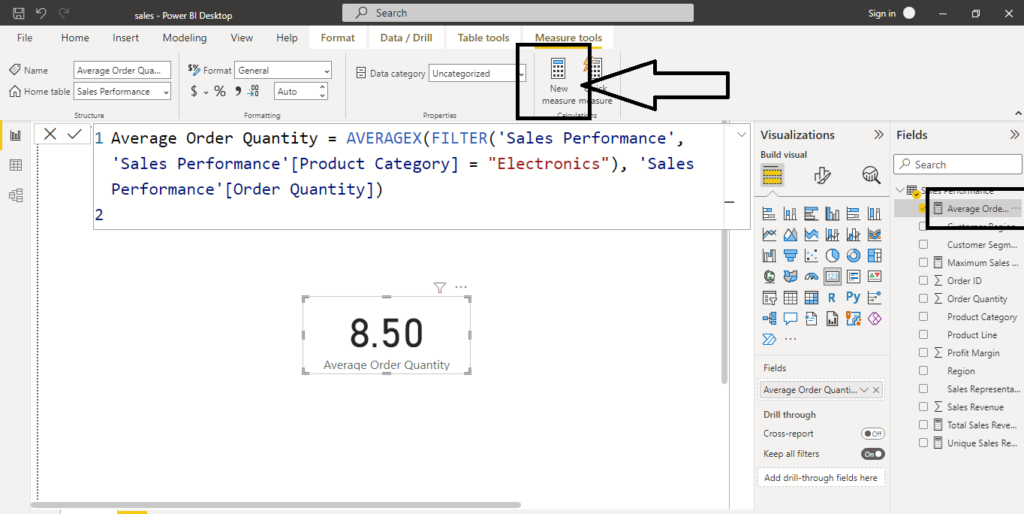
What is the most sales a single order can make in sales?
To find the maximum sales revenue for a single order, you can use the following DAX formula:
Maximum Sales Revenue = MAX('Sales Performance'[Sales Revenue]) 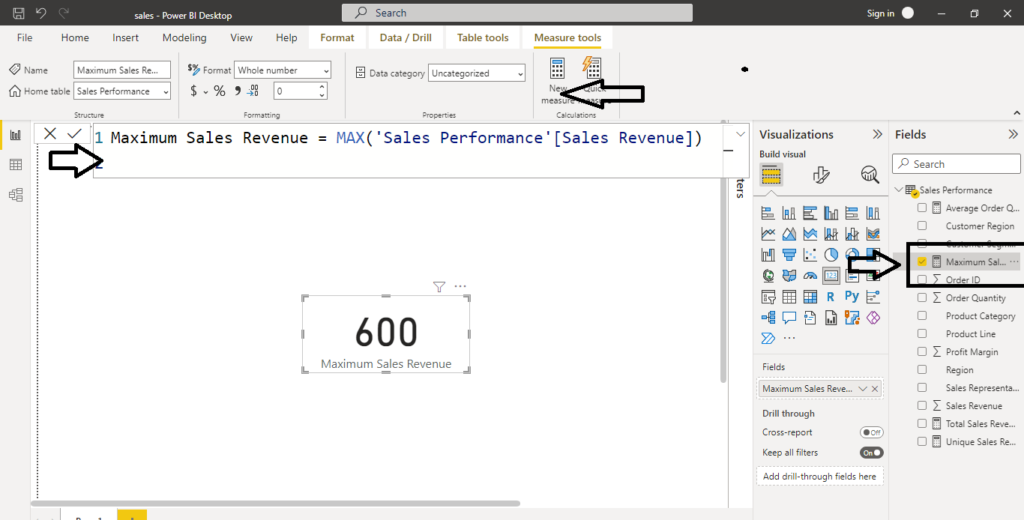
What is the total sales revenue for the Wholesale customer segment?
To calculate the total sales revenue for the Wholesale customer segment, you can use the following DAX formula:
Total Sales Revenue Wholesale = CALCULATE(SUM('Sales Performance'[Sales Revenue]), 'Sales Performance'[Customer Segment] = "Wholesale") What is the minimum profit margin for the High-end product line?
To find the minimum profit margin for the High-end product line, you can use the following DAX formula:
Minimum Profit Margin High-end = MINX(FILTER('Sales Performance', 'Sales Performance'[Product Line] = "High-end"), 'Sales Performance'[Profit Margin]) 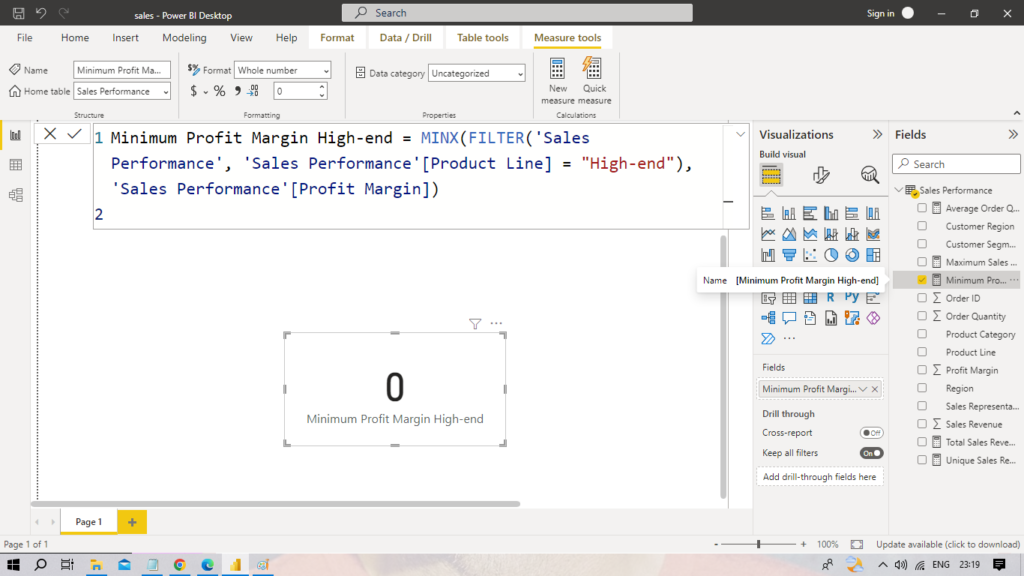
How many orders were placed by each sales representative?
Here are the steps to create the column:
- Open your Power BI report or create a new one.
- In the “Fields” pane, locate the table containing the ‘Sales Performance’ data.
Right-click on the table and select “New Column”. - In the formula bar, enter the following formula
Order Count by Sales Representative = CALCULATE(COUNT('Sales Performance'[Order ID]), ALLEXCEPT('Sales Performance', 'Sales Performance'[Sales Representative]))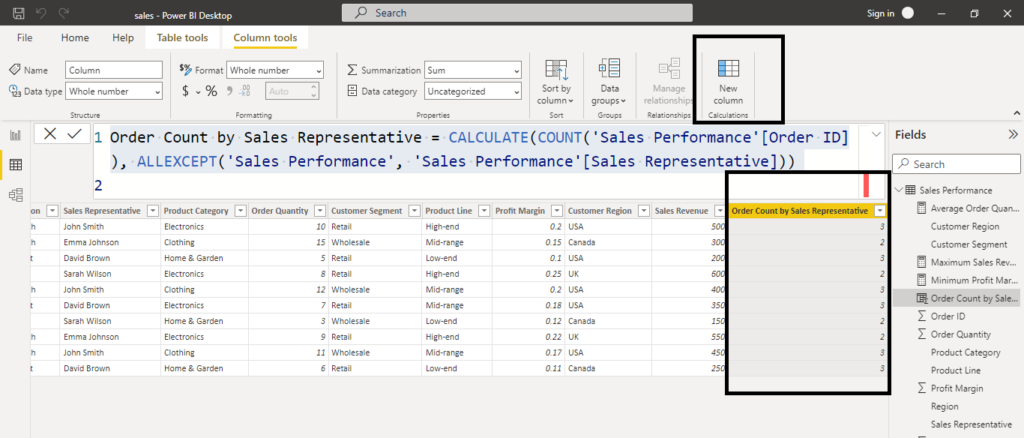
What is the average sales revenue per order?
To calculate the average sales revenue per order, you can use the following DAX formula:
Average Sales Revenue per Order = DIVIDE(SUM('Sales Performance'[Sales Revenue]), COUNT('Sales Performance'[Order ID])) 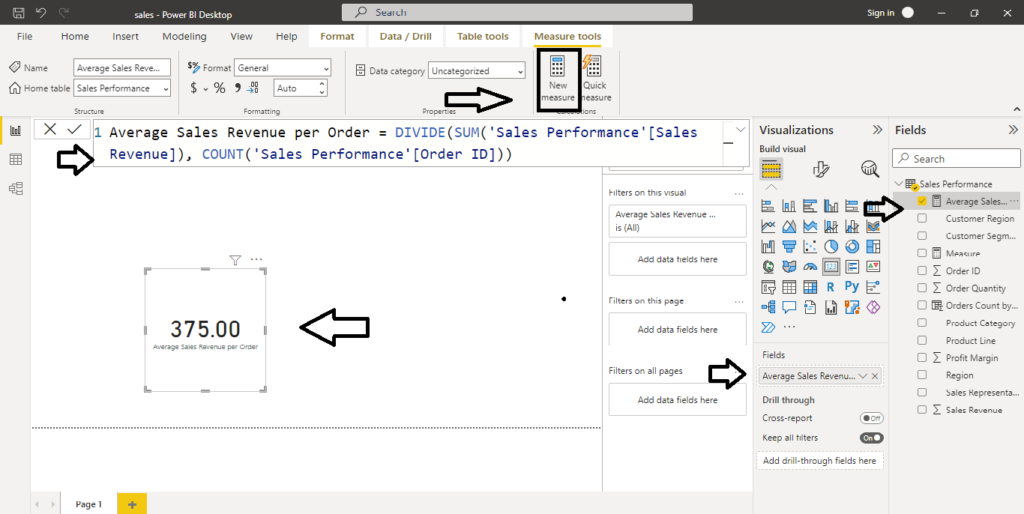
What is the total sales revenue for orders in the USA region?
Total Sales Revenue USA = CALCULATE(SUM('Sales Performance'[Sales Revenue]), 'Sales Performance'[Region] = "USA") Find out name of Top performing Sales man
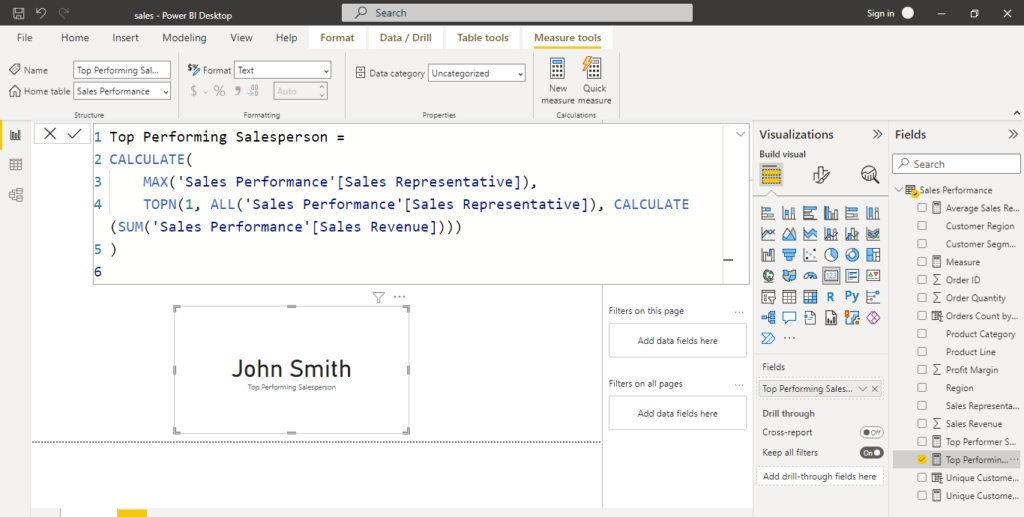
Top Performing Salesperson =
CALCULATE(
MAX('Sales Performance'[Sales Representative]),
TOPN(1, ALL('Sales Performance'[Sales Representative]), CALCULATE(SUM('Sales Performance'[Sales Revenue])))
)
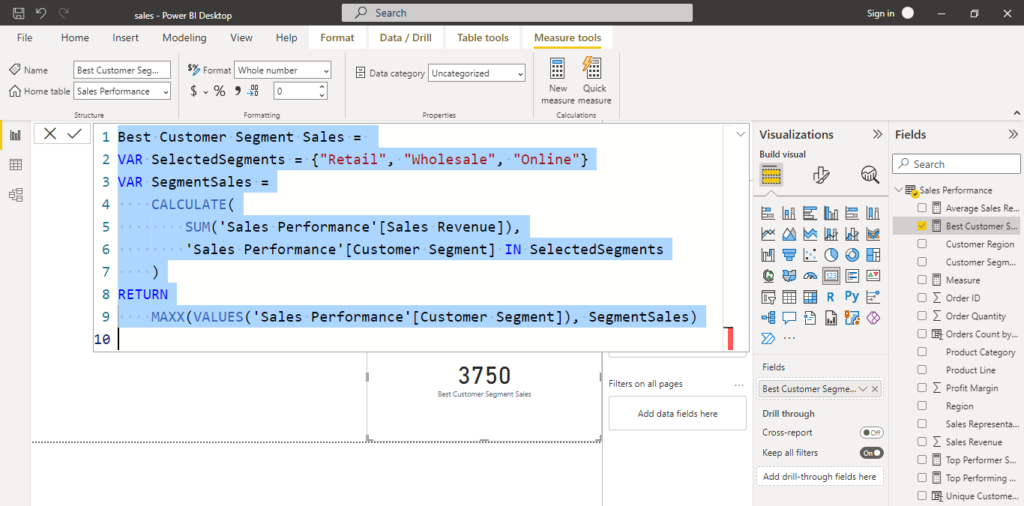
What is Best Customer segment sales
Best Customer Segment Sales =

VAR SelectedSegments = {"Retail", "Wholesale", "Online"}

VAR SegmentSales =

    CALCULATE(

        SUM('Sales Performance'[Sales Revenue]),

        'Sales Performance'[Customer Segment] IN SelectedSegments

    )

RETURN

    MAXX(VALUES('Sales Performance'[Customer Segment]), SegmentSales)
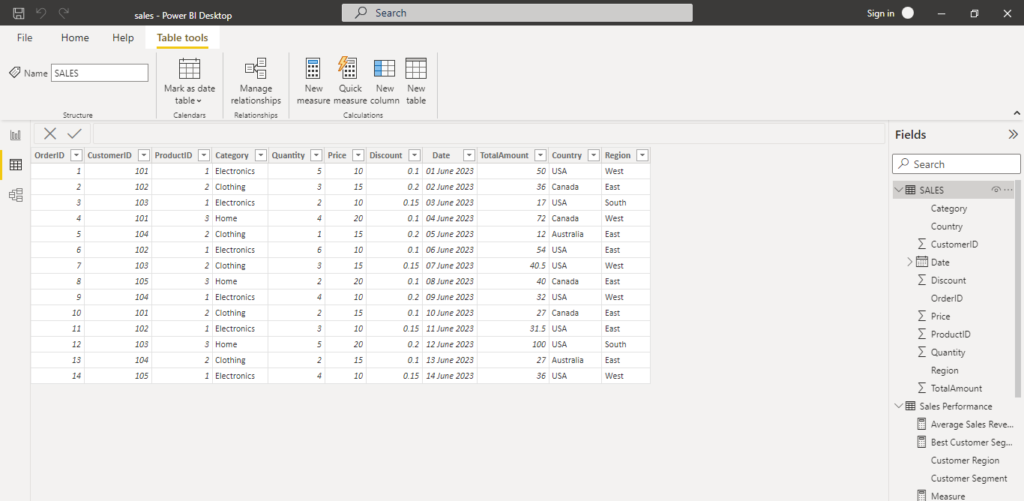
What is total sales in dataset without discount?
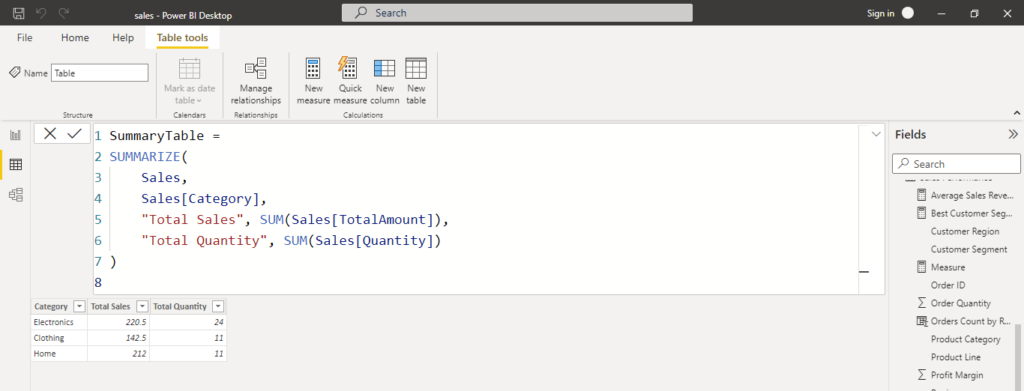
In the above example, we are creating a new table called “SummaryTable” using the SUMMARIZE function. We group the data by the “Category” column from the “Sales” table and calculate the total sales and total quantity using the SUM function.
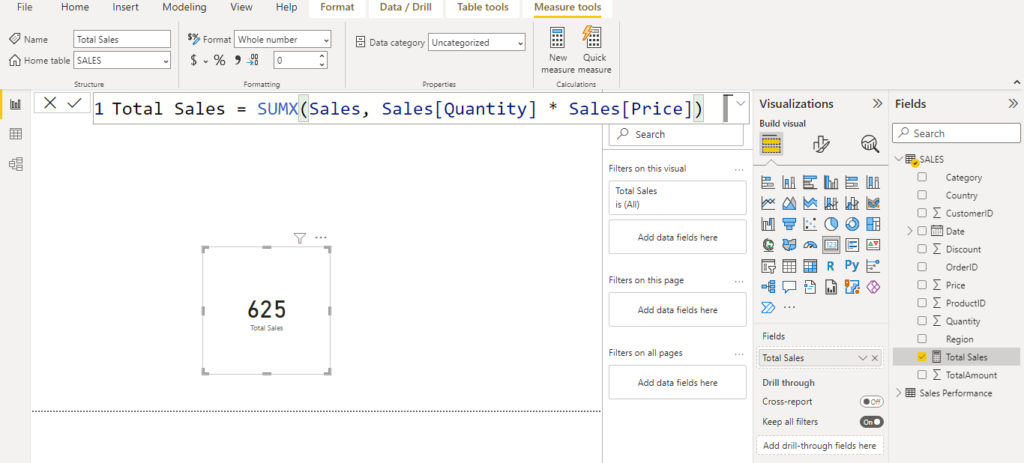
create a summary of total sales and quantity
The SUMMARIZE function in Power BI is used to create a summary table or group data based on one or more columns. It is often used in combination with other aggregation functions like SUM, COUNT, AVERAGE, etc. Here’s an example of how to use the SUMMARIZE function in a dataset:
- Open Power BI Desktop and load your dataset into the data model.
- Go to the “Modeling” tab in the Power BI Desktop.
- Click on “New Table” to create a new calculated table.
- In the formula bar, write the following syntax using the SUMMARIZE function:
SummaryTable =
SUMMARIZE(
Sales,
Sales[Category],
"Total Sales", SUM(Sales[TotalAmount]),
"Total Quantity", SUM(Sales[Quantity])
)
Total discount given in sales
calculate the total discount given, you can create a measure in Power BI using DAX. Assuming you have a table named “Sales Performance” that includes a column named “Discount,” you can use the following DAX formula:
Total Discount Given = SUM('sales'[Discount])Maximum order by country
To find the maximum order by country in the given table using DAX in Power BI, you can use the following steps:
- Open Power BI and navigate to the “Report” view.
- Go to the “Modeling” tab in the ribbon and click on “New Measure” to create a new measure.
- Use the following DAX measure to calculate the maximum order amount for each country:
MaxOrderID = MAX('sales'[Country])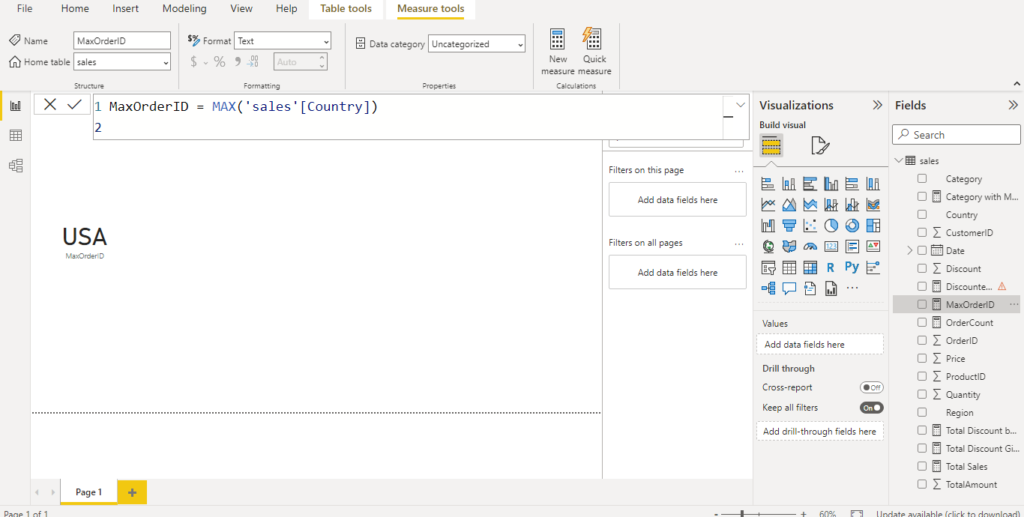
Minimum Order by Country
To find the maximum order by country in the given table using DAX in Power BI, you can use the following steps:
- Open Power BI and navigate to the “Report” view.
- Go to the “Modeling” tab in the ribbon and click on “New Measure” to create a new measure.
- Use the following DAX measure to calculate the maximum order amount for each country:
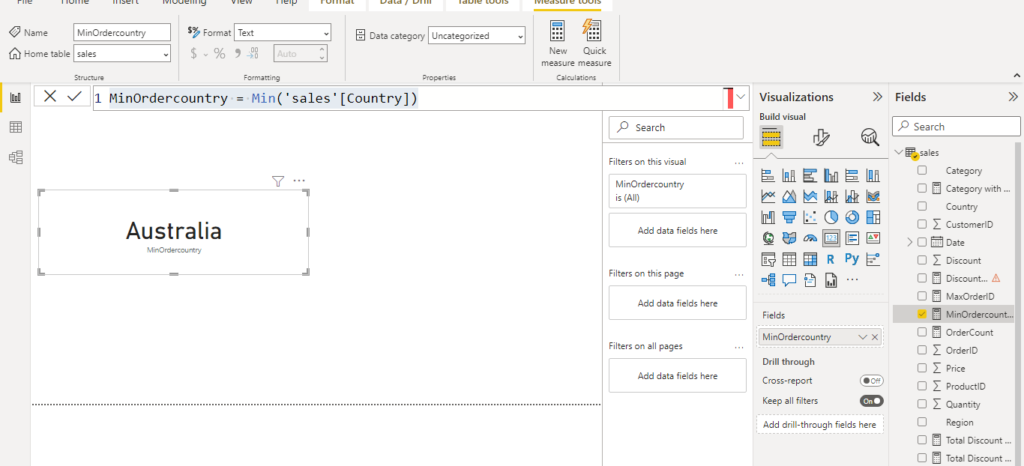
MinOrdercountry = Min('sales'[Country])