Diagram illustrating Descriptive Analytics - monthly reports and charts

✨ Types of Data Analytics: Descriptive, Diagnostic, Predictive & Prescriptive

In today’s digital world, Data Analytics is the backbone of modern business decision-making. From analyzing sales trends to forecasting customer behaviour — not all analytics is the same. This guide explains the 4 key types with examples and business use-cases.

Descriptive • Diagnostic • Predictive • Prescriptive — what they do and when to use them

📊 Descriptive Analytics

Answers: What happened? — Summaries, dashboards, monthly reports and KPIs. Example: Monthly sales reports, traffic dashboards.

🔎 Diagnostic Analytics

Answers: Why did it happen? — Root-cause analysis, drill-downs, correlations. Example: Investigating causes of a sudden sales drop.

📈 Predictive Analytics

Answers: What is likely to happen? — Forecasting, ML models, time-series. Example: Forecasting next quarter’s revenue.

🚀 Prescriptive Analytics

Answers: What should we do? — Decision optimisation, recommendations, simulations. Example: Recommendation engines or inventory reordering rules.

These 4 types of data analytics form a journey — from understanding the past to predicting the future and recommending the best actions. In the next sections we’ll deep-dive into each type with examples, tools, and simple case-studies.

Read Descriptive Analytics ↓

Section 2 Data Analytics Essentials

Who Needs Data Analytics — 5 Key Roles That Benefit & Real Business Wins

Learn how descriptive, diagnostic, predictive, and prescriptive analytics power smarter decisions across marketing, product, finance, HR and more. Read quick examples below — and see which skills will boost your career or team outcomes.

Descriptive Analytics — Summarize Performance & Spot Trends Quickly

Descriptive analytics answers “What happened?” using dashboards, KPIs and summary statistics. It’s the first step teams use to verify performance before they dig deeper.

Mean, median, variance Dashboards & reports Aggregation & filtering Trend visualization

Example: A retail team uses a monthly sales dashboard to compare regions, spot anomalies and find the top 5 products that drove revenue — all classic descriptive analytics.

4 Business Roles That Use Data Analytics — & The Quick Win They Get

Use-cases below show **how each role turns analytics into action**. Click the role to jump to a short example and tools to learn.

Marketers

Quick win: Use descriptive dashboards to measure campaign impact; predictive models to estimate next-month ROI.

See marketer example →

Product Managers

Quick win: Diagnose feature drop-offs, run A/B tests and use prescriptive analytics for roadmap trade-offs.

See product example →

Finance Professionals

Quick win: Forecast revenues and optimise cash flows using predictive and prescriptive models.

See finance example →

HR & DEI Teams

Quick win: Analyze attrition reasons, design retention policies and measure inclusion metrics.

See HR example →
Section 3 Diagnostic Analytics

2️⃣ Diagnostic Analytics — Why It Happened & How to Fix It

When metrics move unexpectedly, teams need answers fast. Diagnostic analytics helps you go beyond “what happened” by identifying root causes, testing hypotheses, and finding the fixes that matter — fast.

Definition: Diagnostic analytics answers “Why did it happen?” through drill-down reports, comparisons, statistical tests and cohort analysis — the practical detective work behind data-driven improvements.

Core techniques
  • Drill-down / drill-through reports
  • Segmentation & cohort analysis
  • Correlation & root-cause mapping
Statistical tools
  • A/B testing & hypothesis tests
  • Regression & correlation analysis
  • Change point detection & anomaly analysis
When to use it
  • Sudden KPI drops or spikes
  • Unexplained user behaviour changes
  • Post-campaign performance surprises

Example: An e-commerce team sees conversion fall 15% overnight. Using diagnostic analytics they segment by traffic source, device and checkout step. The team finds a mobile checkout bug introduced in a recent release — fix deployed, conversion recovers. Takeaway: Diagnostic analytics turns suspicious metrics into actionable fixes.

Pro tip: Pair diagnostic reports with a short A/B test to validate the cause before rolling out wide fixes.

Section 4 Predictive Analytics

3️⃣ Predictive Analytics — Forecast What’s Next & Take Action

Predictive analytics answers “What is likely to happen?” by training models on historical data to forecast future events — customer churn, demand spikes, sales trends — so teams can plan and act proactively.

Regression (Linear/Logistic) Time-series (ARIMA, ETS) Classification (Trees, RF) ML (XGBoost, NN)
How to build
  1. Collect & clean historical data
  2. Feature engineering & validation
  3. Train, test & evaluate models (AUC, RMSE)
When to use
  • Predicting churn or LTV
  • Demand forecasting & inventory
  • Lead scoring & conversion prediction
Common evaluation
  • RMSE / MAE for regression
  • Precision, Recall, AUC for classification
  • Cross-validation & backtesting for time-series

Example: A streaming service uses logistic regression and gradient boosting on engagement metrics to predict which users will churn next month. With targeted retention emails and offers, they reduce churn by 12%—showing how predictive models convert into measurable business results.

Takeaway: Predictive analytics helps teams move from reaction to anticipation, saving cost and improving retention.

Tools: Python (scikit-learn, statsmodels), R (forecast, caret), and platforms like Prophet, Azure ML, or AWS SageMaker are commonly used for predictive pipelines.

Section 5 Prescriptive Analytics

4️⃣ Prescriptive Analytics — Recommend the Best Actions

Prescriptive analytics answers “What should we do?” by combining descriptive, diagnostic and predictive insights with optimization and simulation to recommend concrete decisions that improve outcomes.

How it works
  1. Combine past & predicted insights
  2. Define objectives & constraints
  3. Run optimization/simulation and pick action
When to use
  • Inventory reorder & routing
  • Personalized offers / pricing
  • Resource allocation & scheduling
Common techniques
  • Linear / integer programming
  • Monte Carlo simulation & what-if
  • Reinforcement learning & decision trees

Example: A logistics firm optimizes delivery routes by combining traffic forecasts and vehicle constraints into an integer programming model — reducing fuel costs and delivery times. Takeaway: Prescriptive analytics turns predictions into executable decisions that save time and money.

Tools & frameworks: Python (PuLP, OR-Tools), AMPL/Gurobi for optimization, SimPy for simulation, and RL frameworks like RLlib for prescriptive ML.

4 Type of Data Analytics

⚖️ Key Differences: Descriptive vs Diagnostic vs Predictive vs Prescriptive Analytics

Explore a side-by-side comparison of the four types of data analytics — their purpose, main question, techniques, and expected outcomes. This quick guide helps you decide which analytics method fits your business challenge best.

Comparison of the four main types of data analytics — Descriptive, Diagnostic, Predictive, and Prescriptive.
Type of Data Analytics Purpose Key Question Techniques Used Outcome
Descriptive Analytics Summarizes historical data to understand past events and trends. What happened? Aggregation, visualization, reporting KPIs, dashboards, performance summaries
Diagnostic Analytics Finds the reasons behind outcomes and performance changes. Why did it happen? Drill-down, correlation, segmentation, root cause analysis Explains causes of success or failure
Predictive Analytics Uses past data and ML models to forecast future outcomes. What is likely to happen? Regression, time-series, machine learning, classification Predicts risks, opportunities, and behavior patterns
Prescriptive Analytics Recommends best possible actions and strategies. What should we do? Optimization, simulation, AI recommendations, reinforcement learning Actionable plans for decision-making

✅ Together, these four categories — Descriptive, Diagnostic, Predictive, and Prescriptive Analytics — form the complete journey of data-driven decision-making. Test your understanding →

🎯 How to Choose the Right Analytics Approach for Your Business

Match your **business goal**, **data maturity**, and resources to the right analytics type — descriptive, diagnostic, predictive or prescriptive — so you turn data into fast, measurable impact.

Four types of data analytics — descriptive, diagnostic, predictive, prescriptive — infographic

📊 Descriptive Analytics

Goal: Understand past performance.
When to use: You need dashboards, monthly reports, or a performance baseline (e.g., sales by region).

🔍 Diagnostic Analytics

Goal: Diagnose issues or anomalies.
When to use: Investigating sudden KPI drops or unexplained spikes (e.g., checkout funnel fall-off).

📈 Predictive Analytics

Goal: Forecast trends or risks.
When to use: Planning resources, estimating churn, or demand forecasting.

🎯 Prescriptive Analytics

Goal: Recommend optimal actions.
When to use: Optimization problems — routing, inventory reorders, personalized pricing.

Goal-first: Start with the question Data-readiness: clean & historical? Resources: tools & expertise available?

Need help choosing? Try the quick quiz to match your business problem to the right analytics type.

✅ Conclusion – Turn Analysis into Action (Quick Recap & Next Steps)

Overview infographic showing Descriptive, Diagnostic, Predictive and Prescriptive analytics

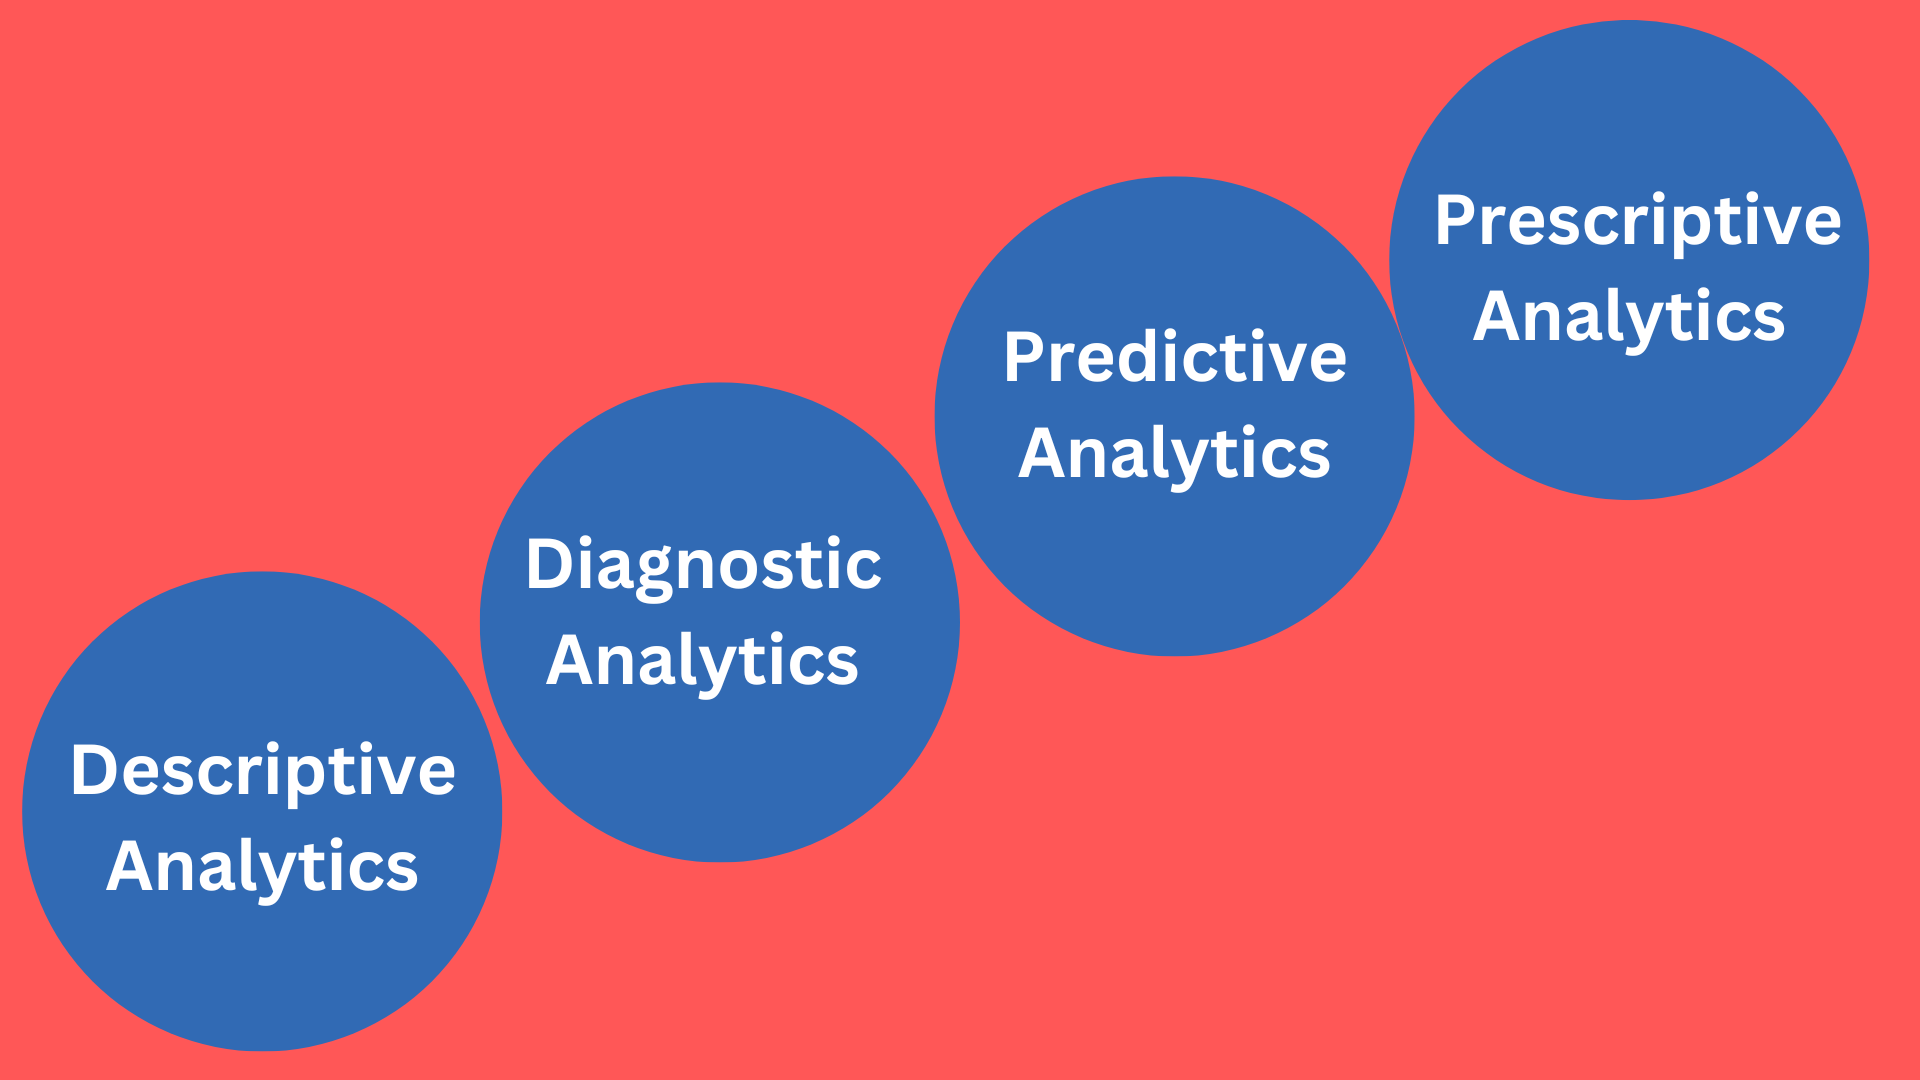
We explored the four core analytics approaches — each one answers a different question and adds different value:

  • Descriptive AnalyticsWhat happened? (dashboards & KPIs)
  • Diagnostic AnalyticsWhy did it happen? (segmentation, root-cause)
  • Predictive AnalyticsWhat is likely to happen? (forecasts & models)
  • Prescriptive AnalyticsWhat should we do? (optimization & recommendations)

Start simple: build descriptive dashboards to create a reliable baseline → diagnose problems → layer predictive models → then use prescriptive techniques to automate better decisions.

Quiz: Types of Data Analytics

12 real-life questions on Descriptive, Diagnostic, Predictive, and Prescriptive analytics. Select answers and submit to see instant feedback.

1) A monthly sales dashboard that shows revenue by region is mostly:
2) Conversions fell last week. You segment by device and find a mobile checkout bug. This is:
3) A churn propensity model using logistic regression primarily represents:
4) Optimizing delivery routes to minimize fuel cost using integer programming is:
5) Summary statistics (mean, median, mode) are most associated with:
6) A/B test to check if a new CTA increases clicks (statistical significance) is mainly:
7) Time-series forecast (ARIMA) for next-quarter demand is:
8) Price optimization to maximize profit under constraints belongs to:
9) A cohort analysis explaining higher churn in users acquired via a discount channel is:
10) Live anomaly alerts on revenue spikes/drops power on-call teams. This is mainly:
11) Marketing mix modeling (MMM) to forecast ROI by channel is:
12) A tool that recommends the best reorder quantity each week using demand forecasts is:

❓ Frequently Asked Questions — Data Analytics

What is the difference between diagnostic and predictive analytics?

Diagnostic analytics explains why something happened (root-cause, segmentation, A/B testing). Predictive analytics uses historical data and models to forecast what is likely to happen next (churn, demand).

Which analytics type is best for real-time decision-making?

Combine **descriptive analytics** (live dashboards & alerts) with lightweight **diagnostic** checks for quick triage. For instant automated actions, use streamlined **prescriptive** systems that apply business rules or optimized recommendations.

How do I get started with prescriptive analytics?

Begin with clean historical data and a clear objective (e.g., minimize cost or maximize fill rate). Pilot a small what-if or optimization model, validate results, then scale while monitoring business metrics.

What are common examples of data analytics techniques?

Descriptive: dashboards, summary statistics
Diagnostic: cohort & root-cause analysis, A/B testing
Predictive: regression, ARIMA, classification models
Prescriptive: Monte Carlo simulation, linear/integer programming, reinforcement learning

What are the four main types of data analytics?

The four main types are Descriptive (what happened), Diagnostic (why it happened), Predictive (what will likely happen) and Prescriptive (what should be done).

📊 डेटा एनालिटिक्स के प्रकार | Types of Data Analytics Explained

इस वीडियो में हमने चार मुख्य प्रकार के डेटा एनालिटिक्स – Descriptive, Diagnostic, Predictive, और Prescriptive – को सरल हिंदी में समझाया है। यह शुरुआत करने वालों के लिए एक बेहतरीन विज़ुअल गाइड है।

Best Data Analytics Course in Dehradun — Vista Academy

Expert-led training in data analysis, visualization, and machine learning — with hands-on projects and real-world case studies to build your portfolio.

Why Choose Vista Academy?

  • Experienced Trainers with strong industry exposure
  • Hands-On Projects to showcase real skills
  • Flexible Learning (online + offline batches)
  • Placement Assistance for analytics roles

What You’ll Learn

  • Data analytics fundamentals & workflows
  • Data visualization & dashboards
  • Statistics for analytics
  • Intro to ML: regression, classification

Contact Us

Address: 316/336, Park Rd, Laxman Chowk, Dehradun, Uttarakhand 248001

Phone: 094117 78145

🚀 Enroll Now
Vista Academy – 316/336, Park Rd, Laxman Chowk, Dehradun – 248001
📞 +91 94117 78145 | 📧 thevistaacademy@gmail.com | 💬 WhatsApp