20 DAX Functions in Power BI to Get Insights

🚀 Microsoft Power BI + DAX: 20 Questions to Unlock Data Insights

Table of Contents

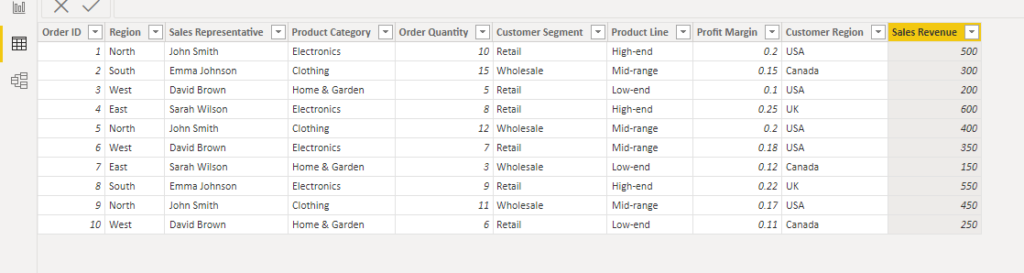
Microsoft Power BI is one of the most powerful data analytics tools that helps businesses discover meaningful insights. In this guide, we will explore 20 practical questions you can answer with DAX (Data Analysis Expressions) inside Power BI.

First, we’ll import data into Power BI and then step-by-step use DAX functions to find the answers you need for better decision making.

dataset for power bi

📥 Download & Use the “Sales Performance” Dataset

To follow along with all the Power BI DAX examples in this guide, download the “Sales Performance” dataset and import it into Power BI. You’ll be able to see each formula in action using real data.

Click here to open the Google Sheets dataset
Then, Download → File → Download as → Excel (.xlsx) or CSV format. Finally, in Power BI Desktop, go to Get Data → Excel/CSV → select your file → Load.

⚠️ Note: Check that the column names match exactly as used in the formulas above (e.g. ‘Sales Revenue’, ‘Order ID’, ‘Customer Segment’, etc.) to avoid errors when applying DAX expressions.

💡 Power BI DAX Question 1: How Much Total Sales Was Made?

To analyze total sales revenue from all orders in your dataset, you can use a simple but powerful DAX function in Power BI. This calculation helps track overall business performance and provides a clear financial picture for decision making.

Total Sales Revenue = SUM('Sales Performance'[Sales Revenue])
    

📌 Note: Sales Performance is the name of the table used in this dataset. You can download the dataset directly from our blog.

🧑‍💼 Power BI DAX Question 3: How Many Unique Sales Agents Are in the Dataset?

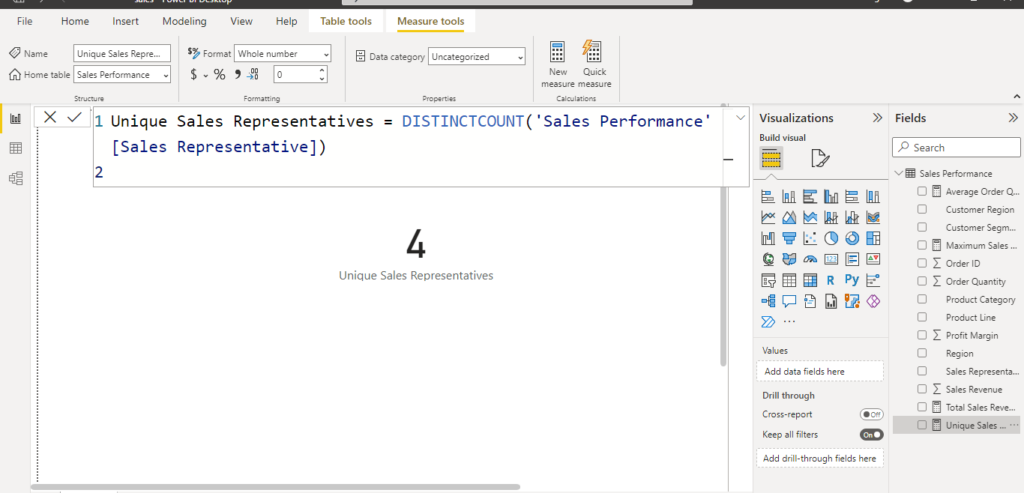
If you want to know the exact number of distinct sales representatives working in your dataset,
Power BI makes it simple with the DISTINCTCOUNT DAX function.
This insight is valuable for sales performance tracking and ensuring accurate reporting.

Unique Sales Representatives =
DISTINCTCOUNT('Sales Performance'[Sales Representative])
    

📌 Note: The DISTINCTCOUNT function ensures each sales agent is counted only once,
even if they appear in multiple transactions within the Sales Performance table.

uniqe sales representative dax function power bi

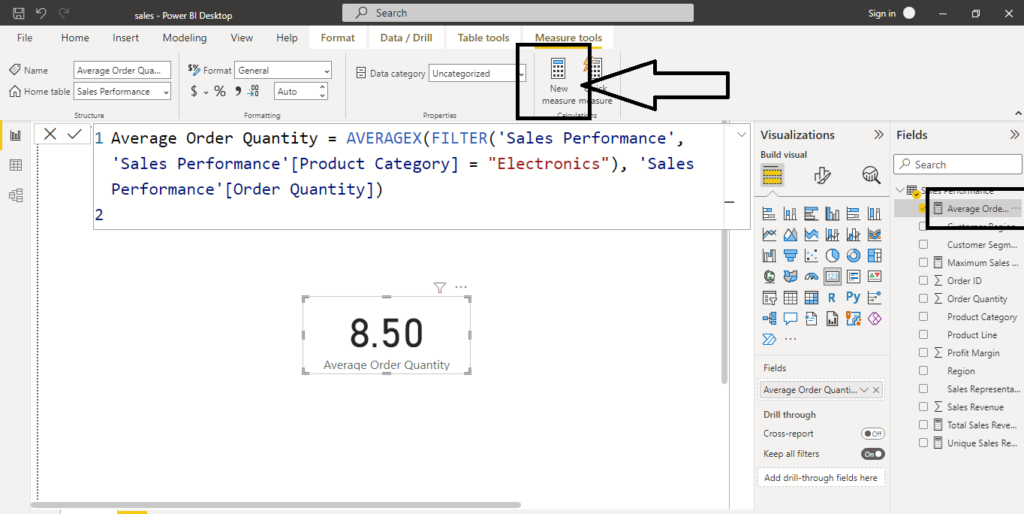
📊 Power BI DAX Question 3: What Is the Average Order Quantity for Electronics?

To understand customer buying patterns in the Electronics product category,
you can calculate the average order quantity using a DAX function in Power BI.
This helps measure demand trends and optimize inventory planning for electronics.

Average Order Quantity =
AVERAGEX(
    FILTER(
        'Sales Performance',
        'Sales Performance'[Product Category] = "Electronics"
    ),
    'Sales Performance'[Order Quantity]
)
    

📌 Note: This formula filters the Sales Performance table for only
Electronics and then computes the average of the Order Quantity.

average order quantity as per quantity dax power bi

📈 Power BI DAX Question 4: What Is the Maximum Sales Revenue?

To determine the highest sales revenue achieved in your dataset, Power BI provides the MAX function in DAX. This measure is useful for identifying top-performing orders or peak revenue points.

Maximum Sales Revenue =
MAX('Sales Performance'[Sales Revenue])
    

📊 Screenshot: Power BI calculation of Maximum Sales Revenue using the DAX formula.

📌 Note: This formula checks all rows in the Sales Performance table and returns the highest value from the Sales Revenue column.

maximum sales in power bi dax data analytics expression

🏬 Power BI DAX Question 5: What Is the Total Sales Revenue for the Wholesale Segment?

Businesses often want to track revenue generated by specific customer segments. To calculate the Total Sales Revenue for Wholesale customers, you can use the CALCULATE function with a filter in DAX.

Total Sales Revenue Wholesale =
CALCULATE(
    SUM('Sales Performance'[Sales Revenue]),
    'Sales Performance'[Customer Segment] = "Wholesale"
)
    

📌 Note: This DAX formula sums only the Sales Revenue for rows where the Customer Segment is Wholesale.

💰 Power BI DAX Question 6: What Is the Minimum Profit Margin for the High-End Product Line?

Analyzing profit margins helps businesses identify lowest-performing products in a specific line. To find the minimum profit margin for the High-end product line, you can use MINX with a filter in Power BI DAX.

Minimum Profit Margin High-end =
MINX(
    FILTER(
        'Sales Performance',
        'Sales Performance'[Product Line] = "High-end"
    ),
    'Sales Performance'[Profit Margin]
)
    

📌 Note: This DAX function scans all rows where the Product Line is High-end and returns the lowest Profit Margin value.

🧾 Power BI DAX Question 7: How Many Orders Were Placed by Each Sales Representative?

To evaluate the performance of each sales representative, you can calculate how many orders they placed. This helps in sales tracking, productivity analysis, and incentive planning. Follow the steps below to create a new calculated column in Power BI.

  1. Open your Power BI report or create a new one.
  2. In the Fields pane, locate the table containing the Sales Performance data.
  3. Right-click on the table and select New Column.
  4. In the formula bar, enter the following DAX expression:
Order Count by Sales Representative =
CALCULATE(
    COUNT('Sales Performance'[Order ID]),
    ALLEXCEPT('Sales Performance', 'Sales Performance'[Sales Representative])
)
    

📌 Note: The ALLEXCEPT function ensures the count is grouped by each Sales Representative, so you get accurate order counts per agent.

order count by each sales representative

💵 Power BI DAX Question 8: What Is the Average Sales Revenue per Order?

To measure revenue efficiency per transaction, you can calculate the average sales revenue per order in Power BI. This DAX calculation helps businesses evaluate customer spending patterns and optimize sales strategies.

Average Sales Revenue per Order =
DIVIDE(
    SUM('Sales Performance'[Sales Revenue]),
    COUNT('Sales Performance'[Order ID])
)
    

📌 Note: The DIVIDE function ensures that the formula safely divides the Total Sales Revenue by the number of Orders, avoiding errors if the denominator is zero.

average sales by dax

🌍 & 🏆 Power BI DAX: USA Sales Revenue & Top-Performing Salesperson

Use these DAX measures to get regional revenue insights and identify top performers from your Sales Performance table. Paste the formulas exactly into Power BI to reproduce the results with your dataset.

📌 Total Sales Revenue — USA Region

Calculate the total sales revenue for orders where Region = “USA”.

Total Sales Revenue USA =
CALCULATE(
    SUM('Sales Performance'[Sales Revenue]),
    'Sales Performance'[Region] = "USA"
)
      

📎 Note: The CALCULATE function applies a row-level filter for the USA region before summing sales revenue.

🏅 Top Performing Salesperson

Find the name of the salesperson with the highest total sales using TOPN and aggregation inside CALCULATE.

Top Performing Salesperson =
CALCULATE(
    MAX('Sales Performance'[Sales Representative]),
    TOPN(1, ALL('Sales Performance'[Sales Representative]), CALCULATE(SUM('Sales Performance'[Sales Revenue])))
)
      

📎 Note: This expression returns the name (MAX used to extract the text) of the top salesperson after ranking all representatives by their total sales.

Find out name of Top performing Sales man

🥇 Power BI DAX Question: Which Customer Segment Is the Best (by Sales)?

Use this measure to compute total sales for a set of key customer segments and return the segment with the highest sales. This helps identify the best-performing customer segment (Retail, Wholesale, or Online) for focused strategy and marketing.

Best Customer Segment Sales =

VAR SelectedSegments = {"Retail", "Wholesale", "Online"}

VAR SegmentSales =

    CALCULATE(

        SUM('Sales Performance'[Sales Revenue]),

        'Sales Performance'[Customer Segment] IN SelectedSegments

    )

RETURN

    MAXX(VALUES('Sales Performance'[Customer Segment]), SegmentSales)
    

How it works: The measure creates a variable SelectedSegments (Retail, Wholesale, Online), calculates total sales for those segments with CALCULATE, and then uses MAXX over segment values to return the segment with the highest aggregated sales.

Use cases: marketing prioritization, channel optimization, customer segmentation analysis, executive reports.

📌 Note: Make sure your ‘Sales Performance’ table has the Customer Segment and Sales Revenue columns exactly named to avoid formula errors. Adjust the segment list in SelectedSegments if you want to evaluate different groups.

best customer segment sales

📥 Next Dataset — Practice with Power BI

Follow along with another practice dataset to apply the DAX measures from this guide. Download the file and import it into Power BI Desktop to reproduce the visualizations and formulas.

Steps to use in Power BI:

  1. Open the Google Sheets link in a new tab.
  2. Go to File → Download and choose Excel (.xlsx) or Comma-separated values (.csv).
  3. Open Power BI Desktop → Get Data → Excel/CSV → select the downloaded file → Load.
  4. Verify column names (e.g., Sales Revenue, Order ID, Product Category, Sales Representative, Region, Customer Segment) match the DAX formulas in the guide.

💡 Pro tip: If your column names differ, either rename the columns in Power BI (Model → rename) or update the DAX formulas to match the exact column names in this file.

💵 Power BI DAX Question: What Is the Total Sales Without Discount?

Sometimes you need to compare actual revenue vs. revenue lost to discounts. Using DAX in Power BI, you can calculate both Total Sales Without Discount and the Total Discount Given. This helps businesses understand real profitability.

📌 Total Sales Without Discount

SummaryTable =
SUMMARIZE(
    'Sales',
    'Sales'[Category],
    "Total Sales", SUM('Sales'[Sales]),
    "Total Quantity", SUM('Sales'[Quantity])
)
    

📌 Total Discount Given

Total Discount Given =
SUM('Sales'[Discount])
    

How it works:

  • SUMMARIZE groups the data by Category and returns Total Sales and Total Quantity.
  • SUM('Sales'[Discount]) calculates the total discount applied across all transactions.

This breakdown is especially useful when analyzing net revenue and discount strategies in retail or e-commerce datasets.

sum x function in power bi

create a summary of total sales and quantity

💵 Power BI DAX Question: What Is the Total Sales Without Discount?

Sometimes you need to compare actual revenue vs. revenue lost to discounts. Using DAX in Power BI, you can calculate both Total Sales Without Discount and the Total Discount Given. This helps businesses understand real profitability.

📌 Total Sales Without Discount

SummaryTable =
SUMMARIZE(
    'Sales',
    'Sales'[Category],
    "Total Sales", SUM('Sales'[Sales]),
    "Total Quantity", SUM('Sales'[Quantity])
)
    

📌 Total Discount Given

Total Discount Given =
SUM('Sales'[Discount])
    

How it works:

  • SUMMARIZE groups the data by Category and returns Total Sales and Total Quantity.
  • SUM('Sales'[Discount]) calculates the total discount applied across all transactions.

This breakdown is especially useful when analyzing net revenue and discount strategies in retail or e-commerce datasets.

summary of total sales and category power bi dax function

🌍 Power BI DAX Question: What Is the Maximum Order by Country?

To analyze which country has the highest order value, you can create a DAX measure. This insight helps compare geographic performance across markets in your Sales dataset.

📌 Maximum Order by Country

MaxOrderID = MAX('Sales'[Country])
    

Note: The above formula returns the maximum country valuemaximum order amount per country, use this instead:

Max Order Amount by Country =
MAXX(
    VALUES('Sales'[Country]),
    CALCULATE(MAX('Sales'[Order Amount]))
)
    

📊 Business Use: Compare sales regions, find top-performing markets, and identify where the largest orders are coming from.

max order by country power dax data analysis

🌍 Power BI DAX Question: What Is the Minimum Order by Country?

To analyze the lowest order values by region, Power BI allows us to create a DAX measure. This can help identify underperforming countries or minimum sales activity in your dataset.

📌 Minimum Order by Country (Basic)

MinOrderCountry =
MIN('Sales'[Country])
    

✅ Minimum Order Amount by Country (Recommended)

Min Order Amount by Country =
MINX(
    VALUES('Sales'[Country]),
    CALCULATE(MIN('Sales'[Order Amount]))
)
    

How it works:

  • MIN('Sales'[Country]) → returns the alphabetically first country name in the dataset.
  • MINX(...) → calculates the minimum Order Amount for each country, which is usually more meaningful for business analysis.

Business use case: Helps managers track lowest order values by country, detect weak markets, and plan targeted campaigns.

20 DAX function in Power Bi to get insight

🚀 Explore Power BI & Data Analytics Resources

📝 Power BI DAX Quiz with Answers

Test your DAX knowledge with our interactive quiz and detailed answers.

▶ Take Quiz

📊 DAX Functions in Power BI – Examples

Explore practical examples of essential DAX formulas for real-world analysis.

▶ View Examples

⚙️ Power BI Data Modeling & DAX Formulas

Learn advanced data modeling techniques and DAX formulas to build robust reports.

▶ Learn More

🎓 Best Data Analytics Course in Dehradun

Join our comprehensive Data Analytics course covering Power BI, DAX, and Business Intelligence.

▶ Enroll Now
Vista Academy – 316/336, Park Rd, Laxman Chowk, Dehradun – 248001
📞 +91 94117 78145 | 📧 thevistaacademy@gmail.com | 💬 WhatsApp
💬 Chat on WhatsApp: Ask About Our Courses