डेटा साइंस और डेटा एनालिटिक्स का महत्व
Table of Contents
Toggleआज की डिजिटल दुनिया में Data Science और Data Analytics दोनों ही हर उद्योग की रीढ़ बन चुके हैं। यह न केवल व्यवसायिक निर्णयों को आसान बनाते हैं बल्कि भविष्य की दिशा भी तय करते हैं।
❓ क्यों Algorithms सबसे ज़रूरी हैं?
किसी भी डेटा मॉडल की सफलता उसके एल्गोरिद्म पर निर्भर करती है। Algorithms ही वह दिमाग हैं जो raw data को meaningful insights में बदलते हैं।
3. Types of Algorithms in Data Science
नीचे Data Science में सबसे ज़्यादा इस्तेमाल होने वाले एल्गोरिद्म categories दिए गए हैं — हर एक के लिये संक्षिप्त परिचय, प्रमुख एल्गोरिद्म की सूची और एक छोटा use-case दिया गया है।
(a) Supervised Learning Algorithms
Supervised learning में मॉडल को labelled data दिया जाता है — यानी input के साथ सही output भी पता होता है। यह prediction और classification के लिए सबसे ज़्यादा use होता है।
- Linear Regression — continuous value prediction (e.g., price prediction)
- Logistic Regression — binary classification (e.g., email spam detection)
- Decision Tree — interpretable classification/regression
- Random Forest — ensemble of trees, robust and accurate
- Support Vector Machine (SVM) — margin-based classifier
- k-Nearest Neighbors (kNN) — instance-based learning
- Naïve Bayes — probabilistic classifier, fast on text
- Gradient Boosting (XGBoost, LightGBM, CatBoost) — high-performance boosting models
Example use-case: बिक्री (sales) डेटा के आधार पर अगले महीने की बिक्री का अनुमान लगाना (sales forecasting using regression / ensemble models).
(b) Unsupervised Learning Algorithms
Unsupervised learning में labels नहीं होते — मॉडल patterns, groups या data structure ढूँढता है। यह exploratory analysis और segmentation के लिए useful है।
- K-Means Clustering — simple and fast clustering
- Hierarchical Clustering — tree-based clusters
- DBSCAN — density-based clustering for irregular shapes
- PCA (Principal Component Analysis) — dimensionality reduction
- t-SNE — visualization-focused non-linear reduction
Example use-case: ग्राहकों को उनके खरीद पैटर्न के अनुसार segment करना (customer segmentation using k-means / hierarchical clustering).
(c) Reinforcement Learning Algorithms
Reinforcement learning में agent environment के साथ interactions से सीखता है — rewards और penalties के आधार पर policies develop होती हैं।
- Q-Learning — value-based tabular RL
- Deep Q-Networks (DQN) — value-based with neural networks
- SARSA — on-policy learning
- Policy Gradient Methods — direct policy optimization
- Actor-Critic Methods — combine value and policy learning
Example use-case: Warehouse robots को सबसे अच्छा path और action सीखाना ताकि order-picking तेज़ हो (path optimization via RL).
(d) Deep Learning Algorithms
Deep learning neural networks बड़े और complex data में patterns सीखने के लिए सबसे powerful techniques हैं — images, text और sequences में बेहतरीन परिणाम।
- Artificial Neural Network (ANN) — basic feedforward networks
- Convolutional Neural Network (CNN) — image and spatial data
- Recurrent Neural Network (RNN) — sequence modelling
- LSTM — long-term dependencies in sequences
- Transformers (BERT, GPT) — state-of-the-art NLP
- Autoencoders — representation learning & anomaly detection
Example use-case: Customer feedback (text) से sentiment analysis और automatic summarization (using Transformers / LSTM).
(e) Ensemble Algorithms
Ensemble methods कई weak learners को combine कर के एक stronger predictor बनाते हैं — bias-variance trade-off को handle करने में मदद करते हैं।
- Bagging — parallel models on bootstrap samples (e.g., Random Forest)
- Boosting — sequential learners improving errors (e.g., XGBoost)
- Stacking — meta-learner combines base models
Example use-case: Banking में credit-default prediction जहाँ high accuracy जरूरी हो (stacked ensemble of trees + logistic model).
Popular Algorithm Categories — Quick Visual
Tip: यह chart दर्शाता है किทั่วไปतः कौन-कौन से categories projects में अधिक इस्तेमाल होते हैं — आप data बदलकर इसे project-wise customize कर सकते हैं।
Data Science vs Data Analytics Algorithms
| Feature / Algorithms | Data Science | Data Analytics |
|---|---|---|
| Supervised Learning | Regression, Decision Trees, SVM | Predictive Analytics (Regression, Forecasting) |
| Unsupervised Learning | Clustering (K-Means, DBSCAN), PCA | Customer Segmentation, Pattern Discovery |
| Deep Learning | CNN, RNN, Transformers | Limited use (Text Mining, Sentiment Analysis) |
| Reinforcement Learning | Robotics, Self-driving Cars | Rare, Optimization in Operations |
| Optimization | Gradient Descent, Adam | Simulation, Linear Programming |
| Goal | AI/ML model building & automation | Business insights, reporting & decision making |
अक्सर पूछे जाने वाले प्रश्न — Algorithms in Data Science & Analytics
Q1: डेटा साइंस और डेटा एनालिटिक्स में एल्गोरिद्म में क्या अंतर है?
A: डेटा साइंस अक्सर AI/ML model building और complex prediction के लिए Deep Learning/Ensemble algorithms का उपयोग करता है। डेटा एनालिटिक्स का फोकस business insights, reporting और predictive analytics (regression, ARIMA) पर होता है। दोनों में overlap है पर उद्देश्य अलग होता है।
Q2: Supervised और Unsupervised learning कब उपयोग करें?
A: अगर आपके पास labelled data है (target variable) तो Supervised methods (जैसे Regression, Decision Trees) use करें। अगर labels नहीं हैं और आप patterns/segments खोज रहे हैं तो Unsupervised methods (जैसे K-Means, PCA) बेहतर हैं।
Q3: Predictive Analytics के लिए सबसे अच्छा एल्गोरिद्म कौन सा है?
A: यह डेटा और समस्या पर निर्भर करता है। Time-series forecast के लिए ARIMA/Prophet बढ़िया हैं; structured tabular data पर Random Forest और Gradient Boosting (XGBoost/LightGBM/CatBoost) अक्सर top performers होते हैं।
Q4: Deep Learning कब ज़रूरी है?
A: जब आपके पास बहुत बड़ा और complex data हो — images, audio, text या sequence data — तब CNN, RNN/LSTM या Transformers use करना meaningful होता है। छोटा structured data के लिए classical ML ज्यादा efficient रहता है।
Q5: Ensemble methods क्यों use करते हैं?
A: Ensemble (Bagging/Boosting/Stacking) models कई weak learners combine कर accuracy और robustness बढ़ाते हैं — खासकर noisy real-world data में। उदाहरण: XGBoost अक्सर competitions और business problems में top आता है।
Q6: क्या मैं Data Analytics सीखकर Data Science roles पा सकता हूँ?
A: हाँ — Data Analytics से foundational stats, SQL, visualization और basic ML skills मिलते हैं। अगर आप advanced ML/deep learning सीखते हैं तो Data Scientist roles के लिए भी qualify कर सकते हैं। Vista Academy के practical courses यही path follow करते हैं।
(a) Supervised Learning Algorithms
Supervised learning में मॉडल को labelled data दिया जाता है — यानी input और उसका सही output दोनों पता होते हैं। इसका उपयोग सबसे ज़्यादा prediction (जैसे बिक्री का अनुमान) और classification (जैसे spam email पहचानना) में होता है। नीचे इसके सबसे popular algorithms detail और real-world examples के साथ समझाए गए हैं।
Linear Regression
Continuous value predict करने के लिए इस्तेमाल होता है।
यह input और output के बीच linear relation खोजता है।
Example: घर के size (sq.ft.) और location से घर का price predict करना।
Logistic Regression
Binary classification problems (Yes/No) के लिए।
Probability निकालकर threshold के आधार पर decision करता है।
Example: किसी email का spam या not-spam होना।
Decision Tree
Tree-like structure पर based, हर node पर एक decision rule होता है।
Simple और interpretable।
Example: Bank loan approve करना — income, credit score, age जैसे factors के आधार पर।
Random Forest
कई Decision Trees का ensemble। Accuracy बढ़ती है और overfitting कम होता है।
Example: Fraud detection system — transaction history से suspicious activity पहचानना।
Popularity of Algorithms (Example %)
Note: Values केवल example हैं, आप इन्हें अपने project data के अनुसार बदल सकते हैं।
Support Vector Machine (SVM)
Data points को अलग करने के लिए best hyperplane ढूँढता है। Kernel trick से complex data भी handle करता है।
Example: Face recognition system या text classification (positive vs negative reviews)।
k-Nearest Neighbors (kNN)
New data point को उसके सबसे नज़दीकी पड़ोसियों से compare करता है। Simple लेकिन powerful।
Example: किसी नए user को products recommend करना, based on similar customers’ behavior।
Naïve Bayes
Probabilistic algorithm, Bayes theorem पर आधारित। Text classification में बहुत useful।
Example: Spam filter और sentiment analysis (positive/negative tweets)।
Gradient Boosting (XGBoost, LightGBM, CatBoost)
Sequentially trees बनाकर errors को correct करता है। बहुत high accuracy देता है।
Example: Credit risk modeling, customer churn prediction, recommendation systems।
Visualizing Supervised Algorithms — Linear, Logistic, SVM & kNN
चार interactive diagrams — प्रत्येक के नीचे छोटा explanation. Responsive: mobile पर single-column दिखेगा।
Linear Regression
Scatter points + best-fit line (example: house size → price).
Logistic Regression
Sigmoid curve mapping input → probability (0 to 1) and threshold visualization.
SVM (Hyperplane)
Two-class scatter with separating hyperplane and margins for intuition.
k-NN (Neighborhood)
New point (green) classified by neighbors inside radius — circle shown.
(b) Unsupervised Learning Algorithms
Unsupervised learning में labels नहीं होते — model खुद data में patterns, clusters और structure खोजता है। यह exploratory analysis और segmentation के लिए सबसे useful होता है। नीचे इसके प्रमुख algorithms detail और use-cases सहित दिए गए हैं।
K-Means Clustering
कैसे काम करता है: Data points को K groups में divide करता है, जहाँ हर group का “centroid” होता है। Iteratively centroids adjust होते हैं जब तक best grouping ना मिल जाए।
Use Case: Retail में ग्राहकों को खरीद पैटर्न के आधार पर group करना (loyal, discount-seeker, seasonal buyer)।
Hierarchical Clustering
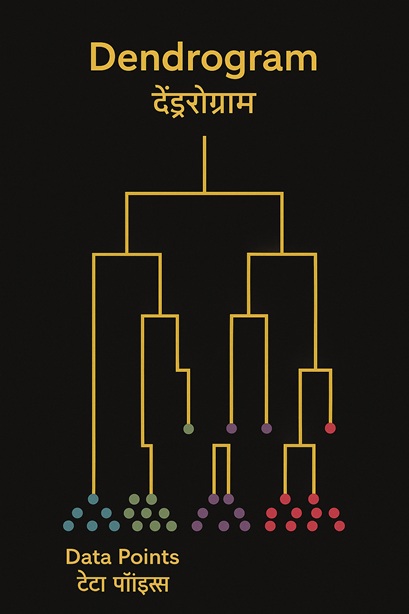
कैसे काम करता है: Clusters को tree (dendrogram) के रूप में बनाता है। Agglomerative method (छोटे clusters को merge करना) या Divisive method (बड़े cluster को split करना) use होता है।
Use Case: Market segmentation — product categories को similarity के आधार पर hierarchical grouping में रखना।
DBSCAN (Density-Based Spatial Clustering)
कैसे काम करता है: High-density points को clusters मानता है और low-density points को noise/outliers। Irregular shaped clusters भी अच्छे से detect करता है।
Use Case: Fraud detection में unusual transaction patterns पहचानना।
PCA (Principal Component Analysis)
कैसे काम करता है: High-dimensional data को कम dimensions में compress करता है (variance preserve करके)। Visualization और faster model training में मदद करता है।
Use Case: Facial recognition में image features को compress करना ताकि computation fast हो।
t-SNE (t-Distributed Stochastic Neighbor Embedding)
कैसे काम करता है: Complex high-dimensional data को 2D/3D में project करता है ताकि visualization आसान हो। Non-linear dimensionality reduction technique है।
Use Case: Biological data (genes, proteins) को visualize करना और hidden clusters detect करना।
✅ Summary: Unsupervised algorithms data के अंदर hidden groups और structures खोजने में मदद करते हैं। Business में ये customer segmentation, fraud detection और visualization में सबसे ज्यादा useful हैं।
Visualizing Unsupervised Learning Algorithms
K-Means, DBSCAN और PCA को scatter plots से visualize किया जा सकता है। Hierarchical और t-SNE के लिए हम बाद में explanatory images जोड़ेंगे।
K-Means Clustering
3 clusters (blue, red, green) और उनके centroids (yellow triangles)।
DBSCAN
High-density clusters (colored) और noise points (grey)।
PCA (Dimensionality Reduction)
High-dimensional data को 2D में reduce करके scatter plot visualization।