“`html
Data Analytics Roadmap 2026: Complete Step-by-Step Guide to Become a Data Analyst
Learn Excel, SQL, Python, Statistics, Power BI, Tableau, AI Tools, Projects, Portfolio, Resume Building, and Interview Preparation in the correct order to become a job-ready Data Analyst in 2026.
The demand for skilled Data Analysts is growing faster than ever as organizations rely on data to make smarter business decisions. Whether you’re a student, working professional, or planning a career switch, following a structured learning path can save months of confusion.
This Data Analytics Roadmap 2026 is a complete guide that explains what to learn, when to learn it, which tools matter most, and how to build real-world projects that employers value. You’ll discover the essential skills needed for today’s data analytics roles, including Excel, SQL, Python, Statistics, Power BI, Tableau, and AI-powered analytics tools.
Unlike generic checklists, this guide focuses on practical learning, portfolio development, interview preparation, and career growth. By the end of this roadmap, you’ll have a clear action plan to become a confident, job-ready Data Analyst.
4–12 Months with consistent practice
Become a Job-Ready Data Analyst in 2026
Excel, SQL, Python, Statistics, Power BI, Tableau & AI
Build real-world projects that impress recruiters
Start Your Data Analytics Journey Today
Follow this roadmap step by step and master the technical skills, business knowledge, and practical experience required to launch a successful career in Data Analytics.

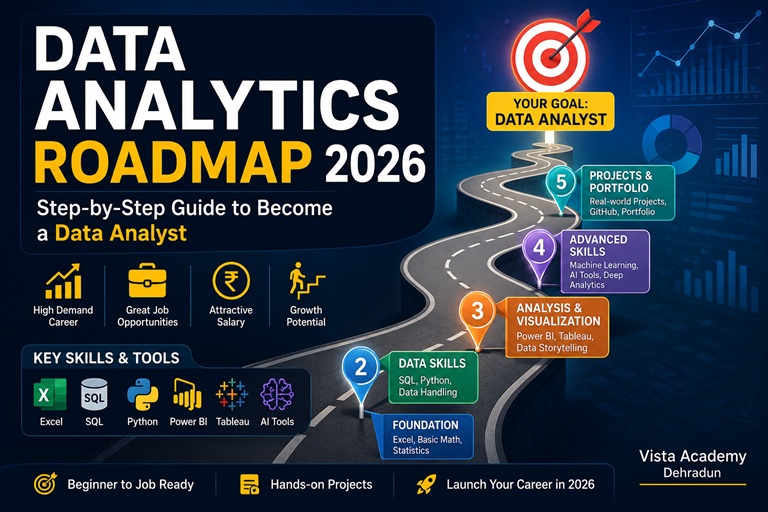
A visual roadmap covering every major skill required to become a successful Data Analyst in 2026, including Excel, SQL, Python, Statistics, Power BI, Tableau, AI tools, portfolio projects, and interview preparation.
“`
What is Data Analytics? Complete Beginner’s Guide (2026)
Data Analytics is the process of collecting, cleaning, organizing, transforming, and analyzing data to discover meaningful insights that help individuals and organizations make better decisions. Every day, businesses generate enormous amounts of data from websites, mobile apps, online purchases, customer interactions, social media, financial transactions, healthcare records, manufacturing systems, and IoT devices. Without proper analysis, this data remains just numbers stored in databases. Data Analytics converts those numbers into actionable business intelligence. In today’s AI-driven world, organizations rely on data analysts to answer critical business questions such as why sales decreased, which marketing campaigns produce the highest ROI, how customer behavior is changing, which products generate maximum profit, and what future trends should be expected. Whether you want to become a Data Analyst, Business Analyst, Power BI Developer, or Data Scientist, understanding Data Analytics is the first and most important step in your learning journey.
Why is Data Analytics Important?
Modern businesses no longer rely only on experience or intuition. Instead, they make data-driven decisions backed by measurable evidence. Every click on an e-commerce website, every payment made through UPI, every hospital patient record, every flight booking, and every social media interaction generates valuable information. Companies use this information to understand customer preferences, optimize business operations, forecast future demand, identify risks, reduce operational costs, and improve customer satisfaction. Organizations that effectively use data often outperform competitors because they can respond quickly to market changes and customer needs. For example, Netflix analyzes millions of viewing records every day to recommend personalized movies and TV shows. Amazon studies customer purchasing behavior to recommend products and manage inventory efficiently. Banks use analytics to detect fraudulent transactions in real time, while hospitals analyze patient data to improve healthcare outcomes.
Types of Data Analytics
Data Analytics is generally divided into four major categories. Understanding these types helps beginners build a strong foundation before learning advanced analytics techniques.
Data Analytics vs Data Science
Think of Data Analytics as understanding the past and present of a business, while Data Science focuses on predicting the future. Most successful Data Scientists begin their careers by learning Data Analytics because it provides the business understanding, SQL skills, visualization techniques, and statistical foundation needed for advanced AI projects.
Business Intelligence vs Data Analytics
Business Intelligence (BI) and Data Analytics are closely related but serve different purposes. BI primarily focuses on monitoring business performance through dashboards, reports, and KPIs. Data Analytics explores deeper questions, identifies hidden trends, discovers root causes, and supports strategic decision-making. Popular BI tools include Power BI, Tableau, Looker Studio, and Qlik Sense. Modern organizations often combine Business Intelligence with Artificial Intelligence to create intelligent dashboards capable of generating automated insights.
💡 Pro Tip: Learning Excel → SQL → Python → Power BI is the most effective sequence for beginners following the Data Analytics Roadmap 2026.
🎓 Ready to Start Your Data Analytics Journey?
Master Excel, SQL, Python, Statistics, Power BI, Tableau, AI Tools, and real-world projects through Vista Academy’s industry-oriented Data Analytics training program. Build practical skills, create an impressive portfolio, and become job-ready with expert guidance.
Why Learn Data Analytics in 2026?
Data Analytics has become one of the fastest-growing career fields in the world. Organizations no longer rely only on experience or intuition to make business decisions. Instead, they collect millions of rows of data every day from websites, mobile applications, customer purchases, social media, financial transactions, sensors, healthcare systems, and business operations. This data contains valuable insights, but only skilled professionals can transform it into meaningful information. The Data Analytics Roadmap 2026 is more relevant than ever because Artificial Intelligence, cloud computing, automation, and digital transformation have dramatically increased the demand for professionals who can understand, clean, analyze, and visualize data. Whether you want to work in finance, healthcare, retail, education, manufacturing, government, or technology, data analytics skills are now considered essential rather than optional. Instead of replacing Data Analysts, AI is changing how they work. Modern analysts use AI tools to automate repetitive tasks, generate reports faster, and discover hidden insights. However, businesses still need professionals who understand data quality, business problems, statistics, and decision-making.
Digital Transformation is Creating New Careers
Governments, startups, and established enterprises are investing heavily in digital transformation. Business decisions that once relied on intuition are now supported by dashboards, predictive models, and performance metrics. This shift has created thousands of new opportunities for professionals who can work with Excel, SQL, Python, Power BI, Tableau, and cloud-based analytics platforms. Small businesses use analytics to understand customer behaviour and improve marketing campaigns. Hospitals analyse patient data to improve healthcare delivery. Banks detect fraud through transaction analysis. Manufacturing companies optimise production using operational data. Retail businesses forecast inventory demand and personalise customer experiences. Learning analytics today means building a skill set that is useful across multiple industries rather than being limited to a single domain.
💡 Career Tip: Employers increasingly value candidates who can combine Excel, SQL, Python, and Power BI with business understanding and effective communication skills.
Build a Future-Proof Career
One of the biggest advantages of learning Data Analytics is flexibility. After gaining experience, professionals can specialise in Business Intelligence, Data Engineering, Product Analytics, Marketing Analytics, Financial Analytics, Healthcare Analytics, Supply Chain Analytics, or continue toward Data Science and Machine Learning. The roadmap you follow today creates opportunities for long-term career growth. If you are just beginning your learning journey, focus first on mastering the fundamentals before moving to advanced concepts. A strong foundation in statistics, SQL, Python, and data visualisation will make learning AI and machine learning much easier in the future.
🎓 Start Your Data Analytics Journey with Vista Academy
Learn through industry-focused training, hands-on projects, interview preparation, and practical assignments designed to help you become job-ready.
Future Scope of Data Analytics in 2026 and Beyond
The future of Data Analytics is brighter than ever before. Organizations across the world are investing heavily in Artificial Intelligence, Business Intelligence, Cloud Computing, Digital Transformation, and Automation. These technologies generate enormous volumes of structured and unstructured data every day. However, data alone has little value unless skilled professionals can transform it into actionable insights. A Data Analyst bridges the gap between raw data and business decisions. Whether it is predicting customer demand, improving operational efficiency, reducing costs, detecting fraud, or measuring marketing performance, companies rely on analytics professionals to convert information into measurable business value. As businesses become increasingly data-driven, the demand for professionals with expertise in Excel, SQL, Python, Power BI, Tableau, Statistics, and AI-assisted analytics is expected to continue growing throughout 2026 and beyond.
Average Data Analyst Salary in 2026
Although salaries vary depending on location, industry, company size, and experience, Data Analytics remains one of the highest-paying technology career paths for graduates and career changers. Professionals who continuously improve their SQL, Python, Power BI, and business communication skills generally experience faster salary growth than those who rely on a single tool.
Industries Hiring Data Analysts
How to Stay Ahead in 2026
The technology landscape continues to evolve rapidly. To remain competitive, aspiring Data Analysts should focus on continuous learning. Master the fundamentals first, then gradually expand your expertise into cloud analytics, AI-powered reporting, data storytelling, automation, and advanced dashboard development. Employers increasingly value candidates who demonstrate practical problem-solving skills through real-world projects rather than certifications alone. Building a strong portfolio with business dashboards, SQL case studies, Python analysis notebooks, and Power BI reports will significantly improve your employability and prepare you for technical interviews.
🚀 Learning Strategy: Don’t try to learn every tool at once. Follow the roadmap: Excel → SQL → Statistics → Python → Power BI → Projects → AI Tools → Portfolio → Interview Preparation.
🎯 Become Job-Ready with Vista Academy
Gain hands-on experience with industry projects, expert mentorship, interview preparation, and practical assignments designed to help you launch a successful career in Data Analytics.
Data Analytics Roadmap 2026: Step-by-Step Learning Path
One of the biggest mistakes beginners make is learning tools randomly. They watch YouTube videos about Machine Learning before understanding Excel, or they start learning Python without knowing how data is stored or analyzed. The result is confusion and frustration.
The best way to become a successful Data Analyst is to follow a structured roadmap. Each skill builds upon the previous one, creating a strong foundation for advanced analytics and AI.
The recommended learning order is:
Excel → Statistics → SQL → Python → Power BI → Tableau → Projects → Portfolio → Interview Preparation.
Following this sequence helps you develop analytical thinking while mastering the tools used by companies worldwide.
Step 1 – Master Microsoft Excel
Excel remains one of the most widely used tools in business analytics. Even organizations using advanced software still rely on Excel for reporting, budgeting, financial analysis, forecasting, and dashboard creation.
Before learning programming languages, every aspiring Data Analyst should become comfortable working with spreadsheets, formulas, tables, charts, and Pivot Tables. Excel develops logical thinking and teaches how business data is organized.
Learning Excel first also makes SQL and Power BI easier because many concepts—such as filtering, sorting, grouping, and summarizing data—are similar.
• Cell Referencing
• Formatting
• Sorting & Filtering
• Conditional Formatting
• Tables
Important Formulas
SUM()
AVERAGE()
COUNT()
IF()
XLOOKUP()
INDEX MATCH()
TEXT Functions
Data Analysis Features
Pivot Tables
Pivot Charts
Slicers
Dashboard Creation
Data Validation
Business Applications
Sales Reports
Expense Tracking
Inventory Analysis
Budget Planning
Performance Reports
Pro Tip: Spend at least 2–3 weeks mastering Excel before moving to SQL. Strong Excel skills will help you understand business datasets much faster.
Step 2 – Learn Statistics for Data Analytics
Statistics is the foundation of Data Analytics. Without statistics, dashboards become collections of charts without meaningful interpretation.
Fortunately, you do not need advanced mathematics to become a Data Analyst. Instead, you should understand descriptive statistics, probability, distributions, correlation, hypothesis testing, and sampling.
Statistics helps analysts identify patterns, compare groups, measure variability, detect anomalies, and make evidence-based decisions. Every modern analytics platform—from Excel to Python and Power BI—relies on statistical concepts.
Descriptive Statistics
Mean
Median
Mode
Range
Variance
Standard Deviation
Probability
Basic Probability
Events
Conditional Probability
Bayes Concept
Random Variables
Data Distribution
Normal Distribution
Skewness
Outliers
Quartiles
Percentiles
Business Statistics
Forecasting
Trend Analysis
Customer Behaviour
Sales Analysis
Quality Control
Why Statistics Matters
Imagine a company wants to know whether sales increased because of a new marketing campaign or simply due to seasonal demand. Statistics provides the methods to evaluate evidence rather than relying on assumptions.
Similarly, analysts working in healthcare, finance, manufacturing, education, and government use statistical methods to compare performance, evaluate policies, identify trends, and measure business outcomes.
Understanding statistics also prepares you for Machine Learning, predictive analytics, and Artificial Intelligence.
Build Strong Fundamentals
Before learning Python or Power BI, master Excel and Statistics. These two skills form the backbone of every successful Data Analytics career.
10 Steps to Become a Data Analyst
Step 3 & Step 4
Step 3 – Learn SQL (Structured Query Language)
After learning Excel and Statistics, the next skill in the Data Analytics Roadmap 2026 is SQL. Almost every organization stores its business data inside relational databases instead of spreadsheets. Whether it is customer information, sales records, employee details, banking transactions, hospital records, or e-commerce orders, the information is usually stored inside databases such as MySQL, PostgreSQL, SQL Server, Oracle, or Microsoft SQL Server.
A Data Analyst rarely receives perfectly prepared Excel files. Instead, analysts write SQL queries to retrieve only the required data from millions of records. SQL allows you to filter data, join multiple tables, calculate business metrics, summarize results, and prepare datasets for visualization or reporting.
For this reason, SQL is considered one of the most important technical skills for every Data Analyst.
SQL Basics
• SELECT Statement
• WHERE Clause
• ORDER BY
• LIMIT
• DISTINCT
• Aliases
Working with Tables
• INNER JOIN
• LEFT JOIN
• RIGHT JOIN
• FULL JOIN
• UNION
• SELF JOIN
Aggregation
• COUNT()
• SUM()
• AVG()
• MIN()
• MAX()
• GROUP BY
• HAVING
Advanced SQL
• Window Functions
• CTEs
• Views
• Subqueries
• Stored Procedures
• Index Basics
Learning Goal: Be able to answer business questions using SQL instead of manually filtering Excel sheets.
Real Business Problems Solved Using SQL
A retail company may want to identify its top-selling products over the last six months. A hospital may need to find patients who missed follow-up appointments. A bank may analyse transactions to identify suspicious activity, while an HR department may prepare monthly employee reports. SQL enables analysts to retrieve exactly the information needed without modifying the original database.
Recruiters often include SQL assessment rounds because they want candidates who can write efficient queries and understand how business data is structured. Developing confidence with SQL early in your learning journey will make dashboard creation and advanced analytics much easier.
Step 4 – Learn Python for Data Analytics
Python is one of the most widely used programming languages in Data Analytics because it is simple to learn, highly flexible, and supported by a vast ecosystem of data analysis libraries. Once datasets become too large or repetitive tasks need automation, Python becomes far more efficient than spreadsheets.
Python allows Data Analysts to clean messy datasets, combine multiple files, automate reports, perform statistical analysis, build predictive models, and create visualisations. It is also the primary language used in Artificial Intelligence and Machine Learning, making it an excellent long-term investment for your career.
Do not worry if you have never written code before. Most Data Analysts begin with basic programming concepts and gradually progress toward advanced data analysis.
Python Fundamentals
• Variables
• Data Types
• Loops
• Functions
• Lists
• Dictionaries
NumPy
• Arrays
• Mathematical Operations
• Matrix Calculations
• Broadcasting
• Performance Optimisation
Pandas
• DataFrames
• Reading Files
• Filtering
• Grouping
• Merge
• Missing Values
Data Cleaning
• Duplicate Removal
• Null Values
• Data Formatting
• Feature Creation
• Data Validation
Why Python is Essential for Modern Data Analysts
As businesses generate increasingly large datasets, manual analysis becomes impractical. Python automates repetitive tasks, making analytics faster, more accurate, and easier to reproduce. Analysts use Python to clean customer databases, prepare financial reports, analyse survey responses, process web data, and automate dashboard updates.
Python also integrates seamlessly with SQL databases, Power BI, cloud platforms, and AI frameworks. This makes it one of the most versatile skills in the complete Data Analytics Roadmap 2026.
Although learning Python may seem challenging initially, regular practice through small projects helps build confidence. Focus on understanding the logic behind programming rather than memorising syntax.
Beginner Projects
• Sales Analysis
• Student Database
• Customer Reports
• Expense Tracker
Intermediate Projects
• HR Dashboard
• Retail Analytics
• Banking Analysis
• Inventory Reports
Advanced Projects
• Customer Churn Analysis
• Sales Forecasting
• Recommendation System
• Predictive Analytics
Career Benefit
Python skills significantly improve career opportunities because they combine automation, analytics, AI, and business intelligence into one powerful toolkit.
Roadmap Progress
You have now completed four essential stages of the Data Analytics Roadmap:
Excel → Statistics → SQL → Python.
The next stage focuses on transforming data into meaningful dashboards using Power BI and Tableau.
“`
Step 5 – Master Data Visualization with Power BI and Tableau
After collecting, cleaning, and analyzing data, the next step is presenting insights in a way that decision-makers can easily understand. Most executives do not read hundreds of rows of data or long SQL queries. They prefer interactive dashboards that summarize key performance indicators (KPIs), trends, comparisons, and forecasts. This is why data visualization has become one of the most valuable skills for modern Data Analysts. Tools like Power BI and Tableau allow analysts to transform complex datasets into attractive dashboards that help businesses make faster and better decisions. A dashboard is much more than colorful charts. It tells a business story by highlighting important trends, identifying problems, and supporting strategic planning. Learning visualization also improves communication because analysts must explain insights clearly to managers and stakeholders who may not have technical backgrounds.
• Power Query
• Data Modeling
• Relationships
• Basic DAX
• Dashboard Design
• Bar Charts
• Line Charts
• Maps
• Matrix Reports
• Drill Through
• Dashboards
• Stories
• Filters
• Parameters
• Interactive Reports
• Consistent Colors
• Business KPIs
• Interactive Filters
• Mobile Friendly Reports
💡 Remember: Employers evaluate how well you communicate business insights—not how many charts you can create.
Step 6 – Build Real-World Data Analytics Projects
Projects are the bridge between learning and employment. Recruiters want proof that you can solve business problems using data. Completing tutorials is useful for understanding concepts, but original projects demonstrate practical skills, critical thinking, and problem-solving ability. Each project should begin with a business question, followed by data collection, cleaning, analysis, visualization, conclusions, and recommendations. The objective is not simply to create charts but to provide insights that support better decision-making. Working on projects also teaches data preparation, documentation, presentation, and storytelling—skills that are difficult to develop through theory alone.
Create a Professional Portfolio
A strong portfolio can often make a greater impression than a certificate alone. Instead of showcasing dozens of small exercises, focus on a few high-quality projects that demonstrate your complete workflow—from data collection and cleaning to visualization and business recommendations. Each project should include a clear objective, dataset description, methodology, dashboard screenshots, major findings, and actionable recommendations. Present your work professionally with clear documentation and meaningful visuals. Employers appreciate candidates who can explain not only what they built, but also why it matters to the business. Aim to include projects from different industries such as finance, healthcare, retail, education, manufacturing, and marketing. This demonstrates versatility and the ability to work with diverse business problems.
✔ Dataset Description
✔ Data Cleaning
✔ Analysis
✔ Dashboard
✔ Business Insights
Presentation
Critical Thinking
Business Understanding
Problem Solving
🏆 Portfolio Tip: Five excellent projects with detailed business insights are usually more valuable than twenty incomplete dashboards.
🎯 Your Roadmap Progress
Congratulations! You have completed the core technical roadmap: Excel → Statistics → SQL → Python → Power BI → Tableau → Projects. The next step is preparing your resume, LinkedIn profile, interview strategy, certifications, and applying for Data Analyst roles with confidence.
Step 7 – Resume, LinkedIn & Interview Preparation
Learning technical skills is only one part of becoming a successful Data Analyst. The next challenge is presenting your knowledge professionally to recruiters and hiring managers. Many candidates spend months learning Excel, SQL, Python, Power BI, and Statistics but struggle to secure interviews because their resume does not clearly demonstrate their abilities. A well-structured resume should highlight practical skills, measurable achievements, technical tools, certifications, and real-world projects. Recruiters often spend less than a minute reviewing an application, so your resume should immediately communicate that you can solve business problems using data. Similarly, your LinkedIn profile should act as your online professional portfolio. It should showcase your projects, learning journey, certifications, and analytical thinking. An active profile with quality content, project demonstrations, and professional networking significantly improves visibility to recruiters.
• Technical Skills
• Projects
• Education
• Certifications
• Achievements
SQL
Python
Power BI
Tableau
Statistics
Prepare for Data Analyst Interviews
Most Data Analyst interviews evaluate three areas: technical knowledge, analytical thinking, and communication skills. Interviewers are interested not only in whether you know SQL or Python but also in how you approach a business problem. Practice explaining your projects from beginning to end. Be ready to describe the business objective, data source, cleaning process, analysis performed, dashboard created, insights discovered, and recommendations you provided. Employers value candidates who can communicate technical concepts in simple business language. You should also become comfortable solving case-study questions, interpreting charts, writing SQL queries, and explaining statistical concepts. Confidence comes from practice, not memorization.
Python Logic
Statistics
Dashboard Design
Data Cleaning
Common Mistakes Beginners Should Avoid
🚀 Career Advice: Companies hire professionals who can solve business problems. Focus on building practical skills, completing quality projects, and explaining your work with confidence.
🎯 You’re Ready for the Next Step
By following this roadmap—from Excel and Statistics through SQL, Python, Power BI, Tableau, portfolio development, and interview preparation—you’ll have a structured foundation for launching a successful Data Analytics career in 2026. Continue learning, keep improving your projects, and update your portfolio regularly. Analytics is a field where consistent practice creates long-term career growth.
25 Real-World Data Analytics Projects You Should Build in 2026
One of the biggest differences between an average learner and a job-ready Data Analyst is the quality of projects in their portfolio. Employers want to see how you approach real business problems, clean messy datasets, analyze trends, and communicate insights through dashboards and reports. A strong portfolio demonstrates your technical skills while also showcasing your business understanding, problem-solving ability, and communication. Instead of creating dozens of small practice files, focus on meaningful projects that solve realistic business challenges. The best portfolio contains projects from different industries because it proves that you can work with diverse datasets and adapt your analytical thinking to different business environments.
Beginner-Level Projects
Intermediate-Level Projects
After mastering the fundamentals, begin working on larger datasets that require SQL queries, Python data cleaning, and dashboard development. These projects improve analytical thinking and prepare you for technical interviews.
Advanced Portfolio Projects
Advanced projects demonstrate your ability to solve complex business problems using multiple technologies. These projects typically combine SQL, Python, Power BI, statistics, automation, and business storytelling. Recruiters often ask candidates to explain the business objective, methodology, findings, and recommendations. Well-documented advanced projects significantly improve interview performance.
What Every Project Should Include
🏆 Portfolio Tip: Recruiters are more interested in your analytical thinking and business recommendations than the number of dashboards you create. Focus on quality, documentation, and measurable insights.
📂 Build a Portfolio That Gets Interviews
Aim to complete projects from multiple industries such as finance, healthcare, retail, education, tourism, manufacturing, and marketing. A diverse portfolio demonstrates versatility, technical ability, and strong business understanding—qualities employers consistently look for in Data Analysts.
Top Data Analytics Tools You Must Learn in 2026
One of the most common questions beginners ask is, “Which tools should I learn first?” The answer is simple: don’t try to master every tool at once. Instead, focus on learning the right tools in the correct order.
Companies hire Data Analysts to solve business problems—not because they know a long list of software. Understanding when and why to use a tool is far more valuable than simply adding it to your resume.
Modern analytics projects typically involve collecting data, cleaning it, storing it in databases, analyzing it, creating dashboards, and presenting recommendations. Each stage requires different tools, and together they form a complete analytics workflow.
The Complete Analytics Tool Stack
Excel remains the starting point for almost every aspiring Data Analyst. It is ideal for small datasets, quick calculations, Pivot Tables, charts, reporting, budgeting, and exploratory analysis.
SQL Databases
SQL allows analysts to retrieve, filter, summarize, and combine data stored in relational databases. It is one of the most frequently required technical skills in analytics jobs.
Python
Python automates repetitive tasks, performs advanced analysis, cleans large datasets, creates reports, and supports Artificial Intelligence and Machine Learning workflows.
Power BI
Power BI transforms raw data into interactive dashboards, KPI reports, and business intelligence solutions used by organizations worldwide.
Tableau
Tableau specializes in creating highly interactive dashboards and visual storytelling for business reporting and executive presentations.
Statistics
Statistics helps analysts understand trends, distributions, relationships, and uncertainty while making evidence-based business decisions.
AI Tools for Data Analysts
Artificial Intelligence is changing how analysts work. Rather than replacing Data Analysts, AI helps automate repetitive tasks, generate code, summarize reports, clean data, and improve productivity. Analysts who understand both traditional analytics and AI-assisted workflows will have a competitive advantage in the coming years.
It is important to remember that AI should support your analytical thinking, not replace it. You still need to understand data quality, business logic, statistics, and visualization to evaluate AI-generated outputs correctly.
AI Assistants
Generate formulas, explain SQL queries, write Python code, summarize datasets, and brainstorm analytical approaches.
Automation
Automate repetitive reporting, documentation, data cleaning, and workflow management to improve productivity.
Data Interpretation
Use AI to generate initial insights, then validate results using business knowledge and statistical reasoning.
Report Generation
Prepare executive summaries, documentation, presentations, and business reports more efficiently.
Cloud Platforms and Collaboration Tools
Modern organizations increasingly store data in cloud environments rather than on local computers. Although beginners do not need to master cloud computing immediately, understanding the fundamentals will prepare you for enterprise analytics environments.
Similarly, version control and collaboration tools help analysts work efficiently in teams, document projects, and manage changes throughout the project lifecycle.
Learn the basics of cloud storage, cloud databases, security, and scalable analytics solutions used in modern businesses.
Version Control
Maintain project history, organize files, and collaborate effectively on analytics projects with other team members.
Documentation
Document datasets, assumptions, methodology, dashboards, and recommendations clearly for future reference.
Collaboration
Work with managers, developers, business teams, and decision-makers while communicating insights effectively.
Recommended Learning Order
Excel → Statistics → Business Thinking
SQL → Database Concepts → Data Extraction
Python → Data Cleaning → Data Analysis
Power BI → Tableau → Dashboard Design
Projects → Portfolio → Resume → Interviews
AI Tools → Automation → Cloud Analytics → Career Growth
Learning Strategy: Master one tool completely before moving to the next. A solid understanding of six essential tools is far more valuable than basic knowledge of twenty different technologies.
Build Skills That Employers Actually Need
The strongest Data Analysts are not those who know the most software—they are professionals who understand business problems, choose the right tool for each task, communicate insights effectively, and continuously improve through practical experience.
“`
Data Analyst Salary, Career Path & Job Roles in 2026
Choosing a career is not only about learning technical skills—it is also about understanding long-term growth opportunities. Data Analytics has become one of the most promising career paths because every industry now relies on data to improve decision-making. From startups and multinational companies to healthcare organizations, banks, government departments, manufacturing firms, and e-commerce businesses, organizations are investing in professionals who can transform raw data into actionable insights. Unlike many traditional careers, Data Analytics offers multiple specialization paths. As your experience grows, you can move into leadership positions, specialize in a particular industry, or transition toward advanced fields such as Business Intelligence, Product Analytics, Machine Learning, or Data Science.
Typical Career Progression
Industries Hiring Data Analysts
One of the biggest advantages of Data Analytics is that it is not limited to a single industry. The same analytical skills can be applied to finance, healthcare, retail, education, manufacturing, telecommunications, logistics, energy, insurance, tourism, agriculture, and many other sectors. This flexibility allows professionals to change industries without completely changing careers. As long as you understand business problems and know how to analyse data, your skills remain valuable across multiple domains.
Skills That Increase Your Career Growth
Technical knowledge alone is rarely enough for long-term success. The most successful Data Analysts combine analytical thinking with business knowledge, communication, and continuous learning. Employers value professionals who can explain findings clearly, collaborate with different teams, and recommend practical business actions instead of simply presenting charts. As technology evolves, staying updated with AI-assisted analytics, automation, cloud platforms, and data governance will further strengthen your career prospects.
⭐ Career Advice: Focus on becoming an excellent problem solver rather than trying to learn every available tool. Strong analytical thinking combined with practical experience creates sustainable career growth.
🎯 Your Career Starts With Consistent Practice
Every successful Data Analyst started by learning the fundamentals and gradually building experience through projects. Stay consistent, keep improving your portfolio, strengthen your communication skills, and continue solving real-world business problems. Long-term success comes from continuous improvement rather than learning everything at once.
15 Common Mistakes Beginners Make While Learning Data Analytics
Every year thousands of students begin learning Data Analytics with great enthusiasm, but many lose motivation after only a few weeks. The reason is rarely a lack of intelligence—it is usually because they follow the wrong learning strategy. Some learners jump directly into Artificial Intelligence without understanding Excel or SQL. Others spend months watching tutorials but never build a single project. Many try to memorize syntax instead of learning how to solve business problems. These mistakes slow progress and reduce confidence. Understanding these common pitfalls will help you learn more efficiently and become job-ready faster.
Mistakes That Slow Your Progress
Project-Related Mistakes
Projects are often the deciding factor during interviews. Recruiters expect candidates to demonstrate practical experience, analytical thinking, and business understanding rather than theoretical knowledge alone.
Career Mistakes
Technical skills alone do not guarantee career success. Communication, consistency, and continuous learning are equally important. Employers prefer professionals who can explain insights, collaborate with teams, and adapt to new technologies.
💡 Success Formula: Learn systematically, practise consistently, build meaningful projects, communicate clearly, and continuously improve your analytical thinking.
🏆 Learn Smarter, Not Harder
Avoiding these common mistakes will save months of frustration and help you build stronger technical skills, a better portfolio, and greater confidence during interviews. The goal is not simply to learn tools but to become a professional who can solve real business problems using data.
Frequently Asked Questions About Data Analytics Roadmap 2026
Whether you’re a beginner, student, working professional, or career changer, these frequently asked questions will help you better understand the Data Analytics Roadmap 2026 and prepare for a successful career.
Data Analytics is the process of collecting, cleaning, organizing, analyzing, and visualizing data to discover meaningful insights that help businesses make informed decisions.
The Data Analytics Roadmap 2026 is a structured learning path that helps beginners learn Excel, Statistics, SQL, Python, Power BI, Tableau, portfolio development, and interview preparation in the correct sequence.
Students, graduates, working professionals, business owners, engineers, commerce graduates, and anyone interested in making data-driven decisions can benefit from learning Data Analytics.
No. Most beginners start with Excel and Statistics before learning SQL and Python. Programming skills can be developed gradually through consistent practice.
With regular study and hands-on practice, many learners can build job-ready skills in approximately four to six months. The exact timeline depends on your learning pace, prior experience, and the time you can dedicate each week.
A recommended order is Excel, Statistics, SQL, Python, Power BI, Tableau, and then advanced topics such as AI-assisted analytics and automation.
Both are important but serve different purposes. SQL is primarily used to retrieve and manage data stored in databases, while Python is used for automation, data cleaning, advanced analysis, and building scalable workflows.
Both are powerful visualization tools. Many beginners start with Power BI because of its strong integration with Microsoft products, while Tableau is widely used for interactive business dashboards and visual storytelling.
Yes. Employers often focus more on practical skills, problem-solving ability, projects, and communication than on a specific academic degree. Learners from commerce, science, arts, engineering, and management backgrounds can all build successful careers in Data Analytics.
Yes. As organizations continue investing in digital transformation, AI, cloud technologies, and business intelligence, the demand for skilled Data Analysts is expected to remain strong across multiple industries.
📞 +91 94117 78145 | 📧 thevistaacademy@gmail.com | 💬 WhatsApp