Data Analytics course in Dehradun Uttarakhand
Table of Contents
ToggleWhat is data Analytics
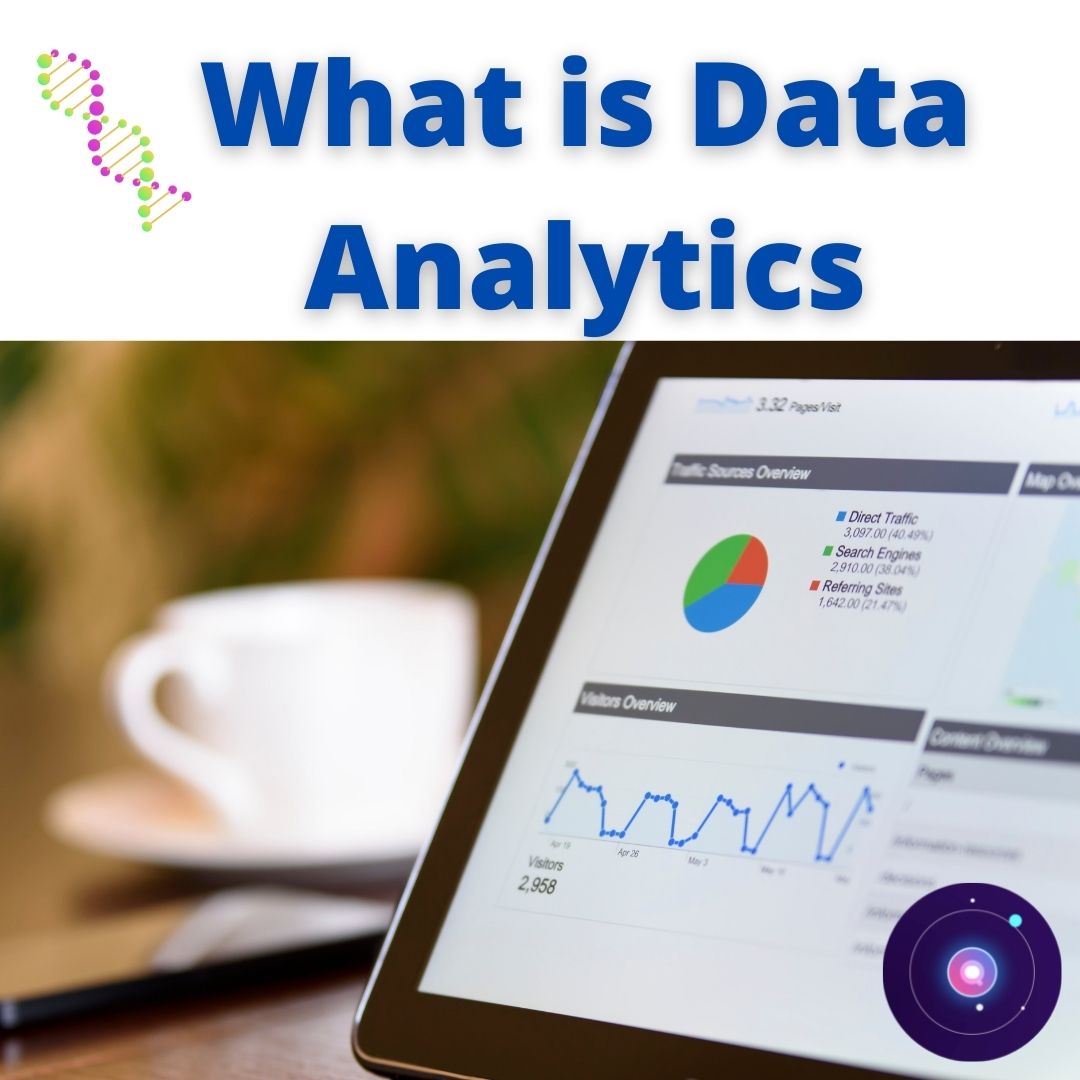
Data analytics is the process of employing sophisticated computer systems to extract meaning from raw data. To draw inferences and find trends, these systems transform, organise, and model data.
Individuals and businesses can benefit from data analytics. Data analysts look for patterns and insights in raw data. They employ a variety of tools.
future of data analytics
Shortages of data specialists will pose problems.
Today’s industry has a visible shortage of qualified data analysts and data scientists, which is projected to deteriorate in the near future. Start making plans now to solve it, whether it’s by offering unique incentives to boost your company’s market competitiveness or by establishing a programme to identify internal prospects and pay their training. Begin right now.
Wider Adoption by business
BI and analytics tools will continue to focus on usability and increasing natural language that enables business users to extract data and create reports without needing to understand the underlying algorithms. Not only will this increase efficiencies and create further adoption throughout companies, but it will also help alleviate some of the problems created by the data scientist shortage.
Large Data Networks are becoming more important.
Access to large data repositories, also known as advanced data networks, will become increasingly valuable for businesses. The vast amount of consumer data contained therein can be used to enhance a company’s existing customer data, allowing them to provide more tailored services and potentially establish new services to satisfy unmet wants and aspirations.
Machine Learning will grow at a faster rate.

Machine learning and artificial intelligence (AI) offer limitless possibilities, and businesses will compete to harness their power and develop new services that provide value in novel ways. Machine learning, according to several industry experts, will soon take over the majority of customer care professions.
Managing Company Data Has Become Even More Difficult
Managing source data and maintaining its correctness and consistency in format has been critical since the beginning of the data analytics and BI assault. The utility of the data ‘coming out’ is determined by the validity of the data ‘going in.’ Finding a solution to this challenge becomes non-negotiable as organisations rely more heavily on this data to manage their businesses.
Interconnectivity is becoming increasingly important for success.
Interconnectivity will be the key to developing a coherent data analytics machine for your business, given the rising reliance on new internal tools for data analysis and BI, as well as the increased need to access external data repositories, networks, and IoT devices.
To remain competitive in the next years, it will be necessary to develop a talent acquisition strategy and to budget for strategic investments well in advance. The requirement to develop process techniques for preserving clean data across all platforms will also be critical.
Contact an experienced data analytics and BI practitioner to organise a discovery session if you want to learn more about any of the subjects above or discuss specifics about your organization’s difficulties.
Job Description for a Data Analyst: Roles and Responsibilities

- Data extraction from primary and secondary sources using automated technologies
Getting rid of damaged data and repairing coding faults and other issues. - Creating and managing databases and data systems, as well as rearranging data into a usable format
- Analyzing data to determine its quality and meaning
- To discover and repair code errors, filter data by evaluating reports and performance metrics.
- Using statistical tools to find, analyse, and interpret patterns and trends in large data sets that can aid in diagnosis and prediction
- Giving critical business functions a numerical value so that business performance may be measured and compared across time.
- Identifying process improvement opportunities, proposing system upgrades, and developing data governance strategies with programmers, engineers, and management heads.
- Final analysis reports are prepared to help stakeholders comprehend the data-analysis steps and make key decisions based on numerous facts and trends.
- Analyzing local, national, and international trends that affect the company and the industry
- Creating management reports that include trends, patterns, and predictions using
Skills for data analytics
SQL (Structured Query Language)
is the industry-standard database language and may be the most crucial ability for data analysts to possess. The language is frequently referred to as a “graduated” version of Excel because it can handle enormous datasets that Excel cannot.
Almost every company requires someone who knows SQL, whether it’s to manage and store data, connect different databases (like the ones Amazon uses to recommend things you might like), or create or update database architecture entirely. Thousands of job posts requiring SQL abilities are made each month.
Excel (Microsoft)
Excel is probably the first thing that springs to mind when you think of a spreadsheet, but it has a lot more analysis capability behind the hood. While a programming language like as R or Python is better suited to dealing with huge data sets, advanced Excel approaches such as building macros and employing VBA lookups are still extensively utilised for smaller lifts and quick analytics. If you work for a small business or a startup, the first version of your database can be Excel. The tool has been a mainstay for firms in every industry over the years, so mastering it is essential.
Thinking Critically
Using data to find answers to your questions requires first determining what questions to ask, which can be difficult. To be successful as an analyst, you must think like one. A data analyst’s job is to find and synthesise relationships that aren’t always obvious. While this talent is partly innate, there are a few strategies you may use to increase your critical thinking abilities. For example, rather than getting carried away with an explanation that is more sophisticated than it needs to be, asking yourself fundamental questions about the problem might help you stay grounded when looking for a solution.
Statistical Programming in R or Python
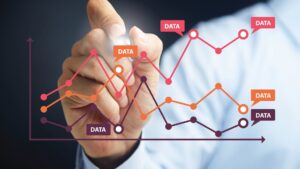
R or Python can do what Excel can—and 10 times faster. R and Python, like SQL, can manage what Excel can’t. They’re advanced statistical programming languages for performing advanced analysis and predictive analytics on large data sets. They are also both industry standards. To effectively operate as a data analyst, you’ll need to know at least one of these languages in addition to SQL.
Visualization of Data
To get your message across and keep your audience engaged, you need to be able to create a captivating tale with facts. You’ll have a hard time getting your message through to others if your findings can’t be simply and immediately recognised. As a result, when it comes to the impact of your data, data visualisation may make or break it. Analysts communicate their conclusions in a clear and succinct manner using eye-catching, high-quality charts and graphs.
Excel and Tableau course
Wheather you work on Excel or Tablue this course will help you to create a dashboard .
It can seem like a difficult effort to go from editing your data and insights in Microsoft Excel to Tableau, but this shift doesn’t have to be difficult. Expert in data visualization Heather Johnson walks you through the transition from Excel to Tableau in this course. Heather begins by going over the fundamentals of utilizing the Tableau desktop application and connecting Tableau to your Excel data source. She then goes over how to create the data worksheets you’ll need to see the data graphically. Finally, Heather offers her advice on designing Tableau dashboards. After taking this course, you’ll be ready to start utilizing Tableau.
What is Tableau.
The tableau analytics platform, the market-leading choice for modern company data, facilitates faster discovery and sharing of insights that have the potential to change industries and the global economy.
We don’t need to know any code, programming languages, technical skills, or even the fundamentals of using any tools to learn Tableau.
| Excel | Tableau |
Data Manipulation and Analysis Capabilities | Excel offers a wide range of data processing and analysis options. It provides a wide range of features, functions, and formulas for cleansing, transforming, and analysing data. Excel may be used to create bespoke formulas and perform complicated calculations. | Tableau is mostly focused on data visualisation even if it offers some data manipulation capabilities. With Tableau, users can connect to a variety of data sources and generate interactive visualisations and dashboards without having to perform significant data processing in the software itself. |
Visual Data Exploration and Interactive Dashboards | Excel provides simple graphing and charting features for visualising data. However, compared to Tableau, producing complex and dynamic visualisations with Excel can be more difficult. | The robust and approachable visual data exploration capabilities of Tableau are well known. Users can quickly and simply generate interactive reports, dashboards, and visualisations. Tableau’s drag-and-drop interface and wide range of pre-built visualisations make it easy for users to swiftly explore data and draw conclusions. |
Scalability and Performance: | Excel can effectively handle smaller datasets, but it could have trouble with larger datasets or difficult calculations. The performance of Excel may begin to deteriorate as the dataset size rises, resulting in slower operations and significant restrictions. | Large and complicated datasets can be handled with Tableau with ease. In order to maximise performance, it makes use of sophisticated data querying and processing algorithms. This enables users to work with sizable datasets and to complete visualisations and analyses more quickly. |
Tableau SQL Course
You will learn how to use Tableau and SQL together in this course. You may learn expert techniques for correctly analysing and visualising your data by using the use cases provided.
Recognise the ideas behind software integration
Learn to use Tableau and SQL at the same time.
Utilise SQL and Tableau to respond to business inquiries.
Data visualisation
Set up dashboards.
What is SQL
The database can be communicated with using SQL. It is the recognised language for relational database management systems, states ANSI (American National Standards Institute). To change data on a database or to obtain data from a database, SQL statements are used.
Skill development
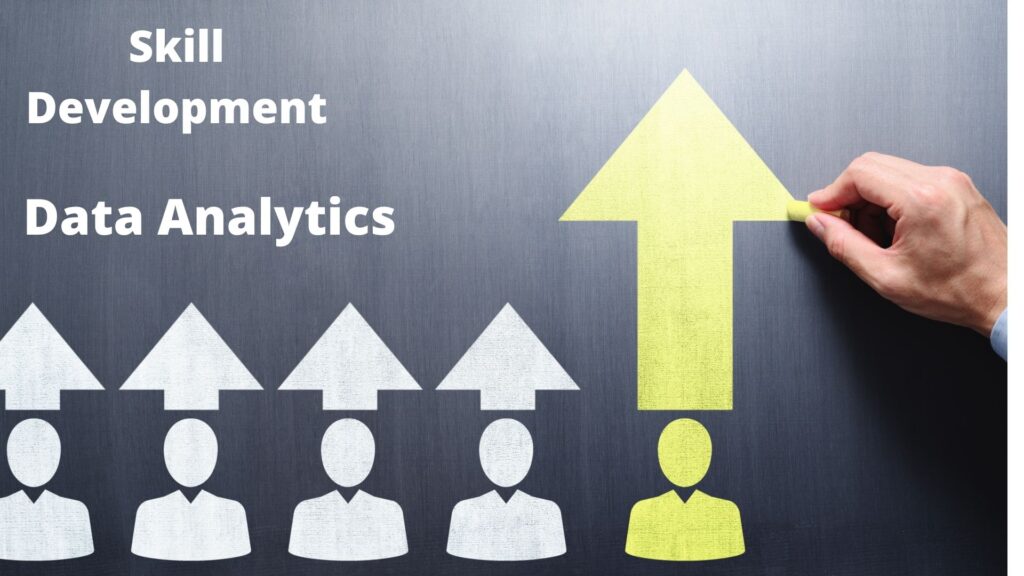
Knowing which skill you’ll need to break into analytics and begin working with data is critical to your data analytics career advancement. Big Data is a hot topic in business, and companies are looking for people with these in-demand, hard-to-find abilities. Improving your data analytics knowledge now will provide you with additional opportunities—and more money—in the future.
If you’re serious about making the switch to analytics, there are several ways to hone these seven talents. Your final decision on how to improve these skills will be based on your prior experience, the time and resources you have available, and your own objectives.
for more you can contact us at Vista Academy
Ways to Use Data Analytics
Decision-making is improved

since guessing and manual duties are eliminated by data analytics. whether it be selecting the appropriate content, organising marketing initiatives, or creating products. Organizations can use the data analytics insights they uncover to make wise decisions. resulting in improved outcomes and satisfied clients.
Improved Customer Service:

Using data analytics, you may customise customer service to meet their demands. Additionally, it offers customisation and strengthens connections with clients. Data analysis can disclose details about clients’ preferences, issues, and more. It enables you to make suggestions for goods and services that are better.
Operations Efficiency:
With the use of data analytics, you may optimise your procedures, reduce costs, and increase output. By having a better grasp of what your audience wants, you may spend less time producing ads and material that doesn’t appeal to them.
Effective Marketing:
Data analytics provides you with useful information on the effectiveness of your efforts. This aids in perfecting them for the best results. You may also identify prospective clients who are most likely to engage with a campaign and turn into leads.
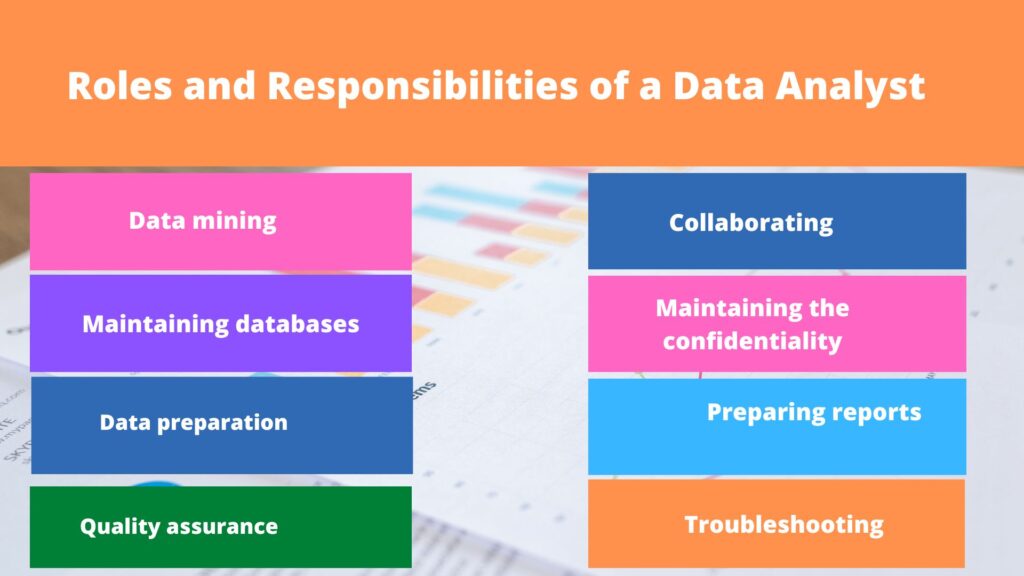
We have already covered the roles and duties of a data analyst with a useful use case. We shall examine the unique tasks and responsibilities of Data Analysts in this section.
In a company, data analysts are responsible for the following:
Data mining:
Data analysts gather information from a variety of primary or secondary sources. They then arrange the data in a suitable format that is simple to understand.
Maintaining databases:
Data analysts assist in the design and upkeep of database systems. A database can be created, updated, read from, and deleted in this manner.
Data mining is the practise of gathering data from many primary and secondary sources. They then arrange the information in an understandable fashion.
Data preparation:
Data gathered from numerous sources will inevitably have errors, duplications, missing values, and many other issues; as a result, the data is in an unprocessed state. After the data has been extracted, data analysts must transform the unstructured data into structured data by fixing data mistakes, deleting unnecessary data, and discovering potential data. To prepare the data for modification and display by data scientists, they use a variety of data cleaning procedures.
Quality assurance
The majority of businesses rely on their data to carry out their daily operations. Therefore, obtaining high-quality data is essential for increasing an organization’s efficiency. Data analysts ensure that the information gathered from various sources is pertinent to the company’s operations.
Working together with other teams:
Database maintenance:
Data analysts help with the setup and maintenance of database systems. This allows for the creation, updating, reading from, and deletion of databases.
Data confidentiality:
Data and information are essential resources for any firm in 2020. Therefore, one of the crucial duties of data analysts today is to protect data and information security.
Preparing reports:
Report creation: Data analysts provide reports that contain important data. These reports include graphs and charts to illustrate business-related factors. Through the analysis of variables like profitability, market analysis, internal activities, etc., they assist in determining the path of corporate growth.
Troubleshooting:
Data analysts assist in troubleshooting information, reports, and database problems.
What Is Data Analytics and How Vista Academy Can Help You Build a Future in This Field
Data analytics is the process of examining, cleaning, transforming, and interpreting data to uncover valuable insights that can inform decision-making. It’s crucial because it enables organizations to make data-driven decisions, leading to improved strategies, efficiency, and competitiveness.
- A career in data analytics is rewarding because it offers high demand and competitive salaries. It allows professionals to work across diverse industries and contribute to solving real-world challenges using data-driven insights.
- Vista Academy offers a comprehensive Data Analytics program that covers essential topics like data collection, data cleaning, data visualization, statistical analysis, and machine learning.
- Our program is taught by experienced instructors and industry experts who provide practical insights and mentorship.
- Students at Vista Academy gain proficiency in industry-standard tools and programming languages such as Python and R.
- We also provide hands-on experience with data analytics software used by leading companies.
Yes, Vista Academy encourages practical learning. Our program includes real-world projects, case studies, and internships, allowing students to apply their skills and build a professional portfolio.
The program typically spans [insert duration] and is designed to equip students with the knowledge and skills needed for entry-level positions in data analytics.
Graduates can pursue various career paths, including roles such as data analyst, data scientist, business analyst, and machine learning engineer. These roles are in high demand across industries.
- Yes, we have a dedicated career services team that assists graduates in finding job placements and internships. We also provide guidance on resume building and interview preparation.
To begin your journey, visit our website, explore our Data Analytics program, and reach out to our admissions team for guidance on the application process.
