Data Cleaning With Python for data analytics

Pythonic Data Cleaning With Pandas and NumPy

What is data cleaning

Data cleansing definition
Before conducting data analysis, a data set must be cleaned of any inaccurate, corrupt, or extraneous information.

By converting your messy, potentially troublesome data into clean data, data cleaning—also known as data cleansing, data scrubbing, and data preparation—serves to elaborate on the basic concept given above. That’s “clean data,” which is defined as information that the potent data analysis engines you invested in can truly utilize.

Additionally, and perhaps even more importantly, Python can be used to programme the great majority of datasets. Python’s significance is increased by the fact that data scientists use Numpy and Pandas, two Python libraries (i.e., pre-programmed toolsets), for data preparation and other types of analysis.What else is there to say? However, let’s get down to business and use these libraries to actually clean our data.

Python Data Cleaning

We will now guide you through the set of activities indicated below using Pandas and NumPy. We’ll offer a very brief overview of the assignment before describing the required code using the terms INPUT (what you should enter) and OUTPUT (what you should see as a result). Where applicable, we’ll also include notes and advice to assist you understand any confusing passages.

  1. The basic data cleansing chores that we’ll take on are as follows:
  2. Importing Libraries
  3. Input Customer Feedback Dataset
  4. Locate Missing Data
  5. Check for Duplicates
  6. Detect Outliers
    Normalize Casing

Importing Libraries

Let’s get your Python script going with NumPy and Pandas installed.
INPUT:
import pandas as pd
import numpy as np

OUTPUT:

In this situation, the libraries should have been loaded into your script by this point. In our next step, you’ll input a dataset to verify whether this is the case.


Enter the Dataset of Customer Feedback

The feedback dataset is then read by our libraries. Let’s have a look at that.

INPUT:

data = pd.read_csv(‘feedback.csv’)

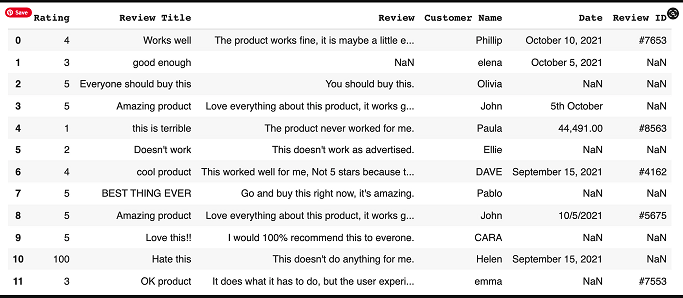
As you can see, the dataset you wish to look at is “feedback.csv”. And in this instance, we know we are utilising the Pandas library to read our dataset as we see “pd.read csv” as the prior function.

Locate Missing Data

The isnull function, a sophisticated Python hack, will then be used to find our data. Actually a common function, “isnull” aids in locating missing items in our collection. This information is helpful since it shows what has to be fixed throughout the data cleaning process.
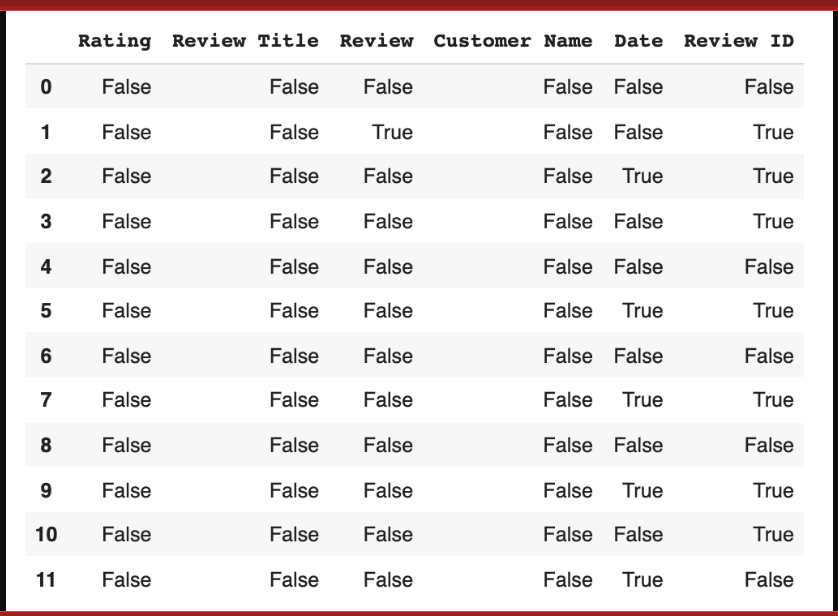
data.isnull()

We get a collection of boolean values as our output result.

The list can provide us with a variety of insights. The first thing to consider is where the missing data is; any column with a ‘True’ reading denotes that the data file’s category for that column contains missing data.

Datapoint 1 has missing information in its Review section and Review ID section, for instance (both are marked true).

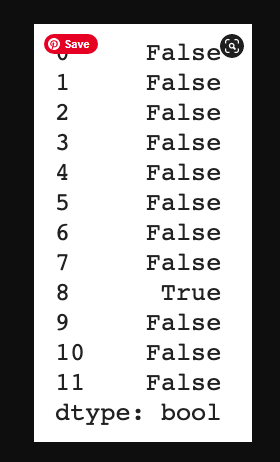
Each feature’s missing data can be expanded further by coding:

Dropping the data
Another choice will need to be made: to maintain the data in the set while simply dropping the missing values, or to completely remove the feature (the entire column) because there are so many missing datapoints that it is unusable for analysis.

You must go in and label the missing values as void in accordance with Pandas or NumBy standards if you want to remove them (see section below). However, this is the code to remove the full column:

INPUT:

remove = [‘Review ID’,’Date’]
data.drop(remove, inplace =True, axis =1)

2. Input any missing data
Technically speaking, adding individual values using Pandas or NumBy standards is the same as adding missing data; we refer to it as adding “No Review.” When entering missing data, you have two options: manually enter the right information or add “No Review” using the code below.

INPUT:

data[‘Review’] = data[‘Review’].fillna(‘No review’)

Check for Duplicates

Similar to missing data, duplicates are problematic and choke analytics tools. Let’s find them and get rid of them.

In order to find duplicates, we start with:

data.duplicated()

data.drop_duplicates()

Detect Outliers

Outliers are numerical values that lie significantly outside of the statistical norm. Cutting that down from unnecessary science garble – they are data points that are so out of range they are likely misreads. 


They, like duplicates, need to be removed. Let’s sniff out an outlier by first, pulling up our dataset.

INPUT:

data[‘Rating’].describe()

10 common NumPy functions that are useful for data analysis: 10 common use cases for SQL in data analytics 10 commonly used Matplotlib commands for data analytics 10 different between SQL and No SQL 10 important of data analytics for society 10 steps that show how data analytics is changing the banking industry: 10 steps to learn SQL for Data Analytics 10 steps to start career in data science 10 WAYS AGRICULTURE IS TRANSFORMED BY DATA ANALYTICS 10 ways data analytics can be used in addressing climate change: