
```html
๐Ÿ“‹ Get Course Details
```

Top Essential Data Science Skills You Need in 2025

To succeed as a Data Scientist in 2025, you need more than just coding or math tricks. Employers now look for a balanced mix of technical expertise, mathematical foundations, and non-technical competencies. Letโ€™s start with the big picture of must-have skills before diving into details.
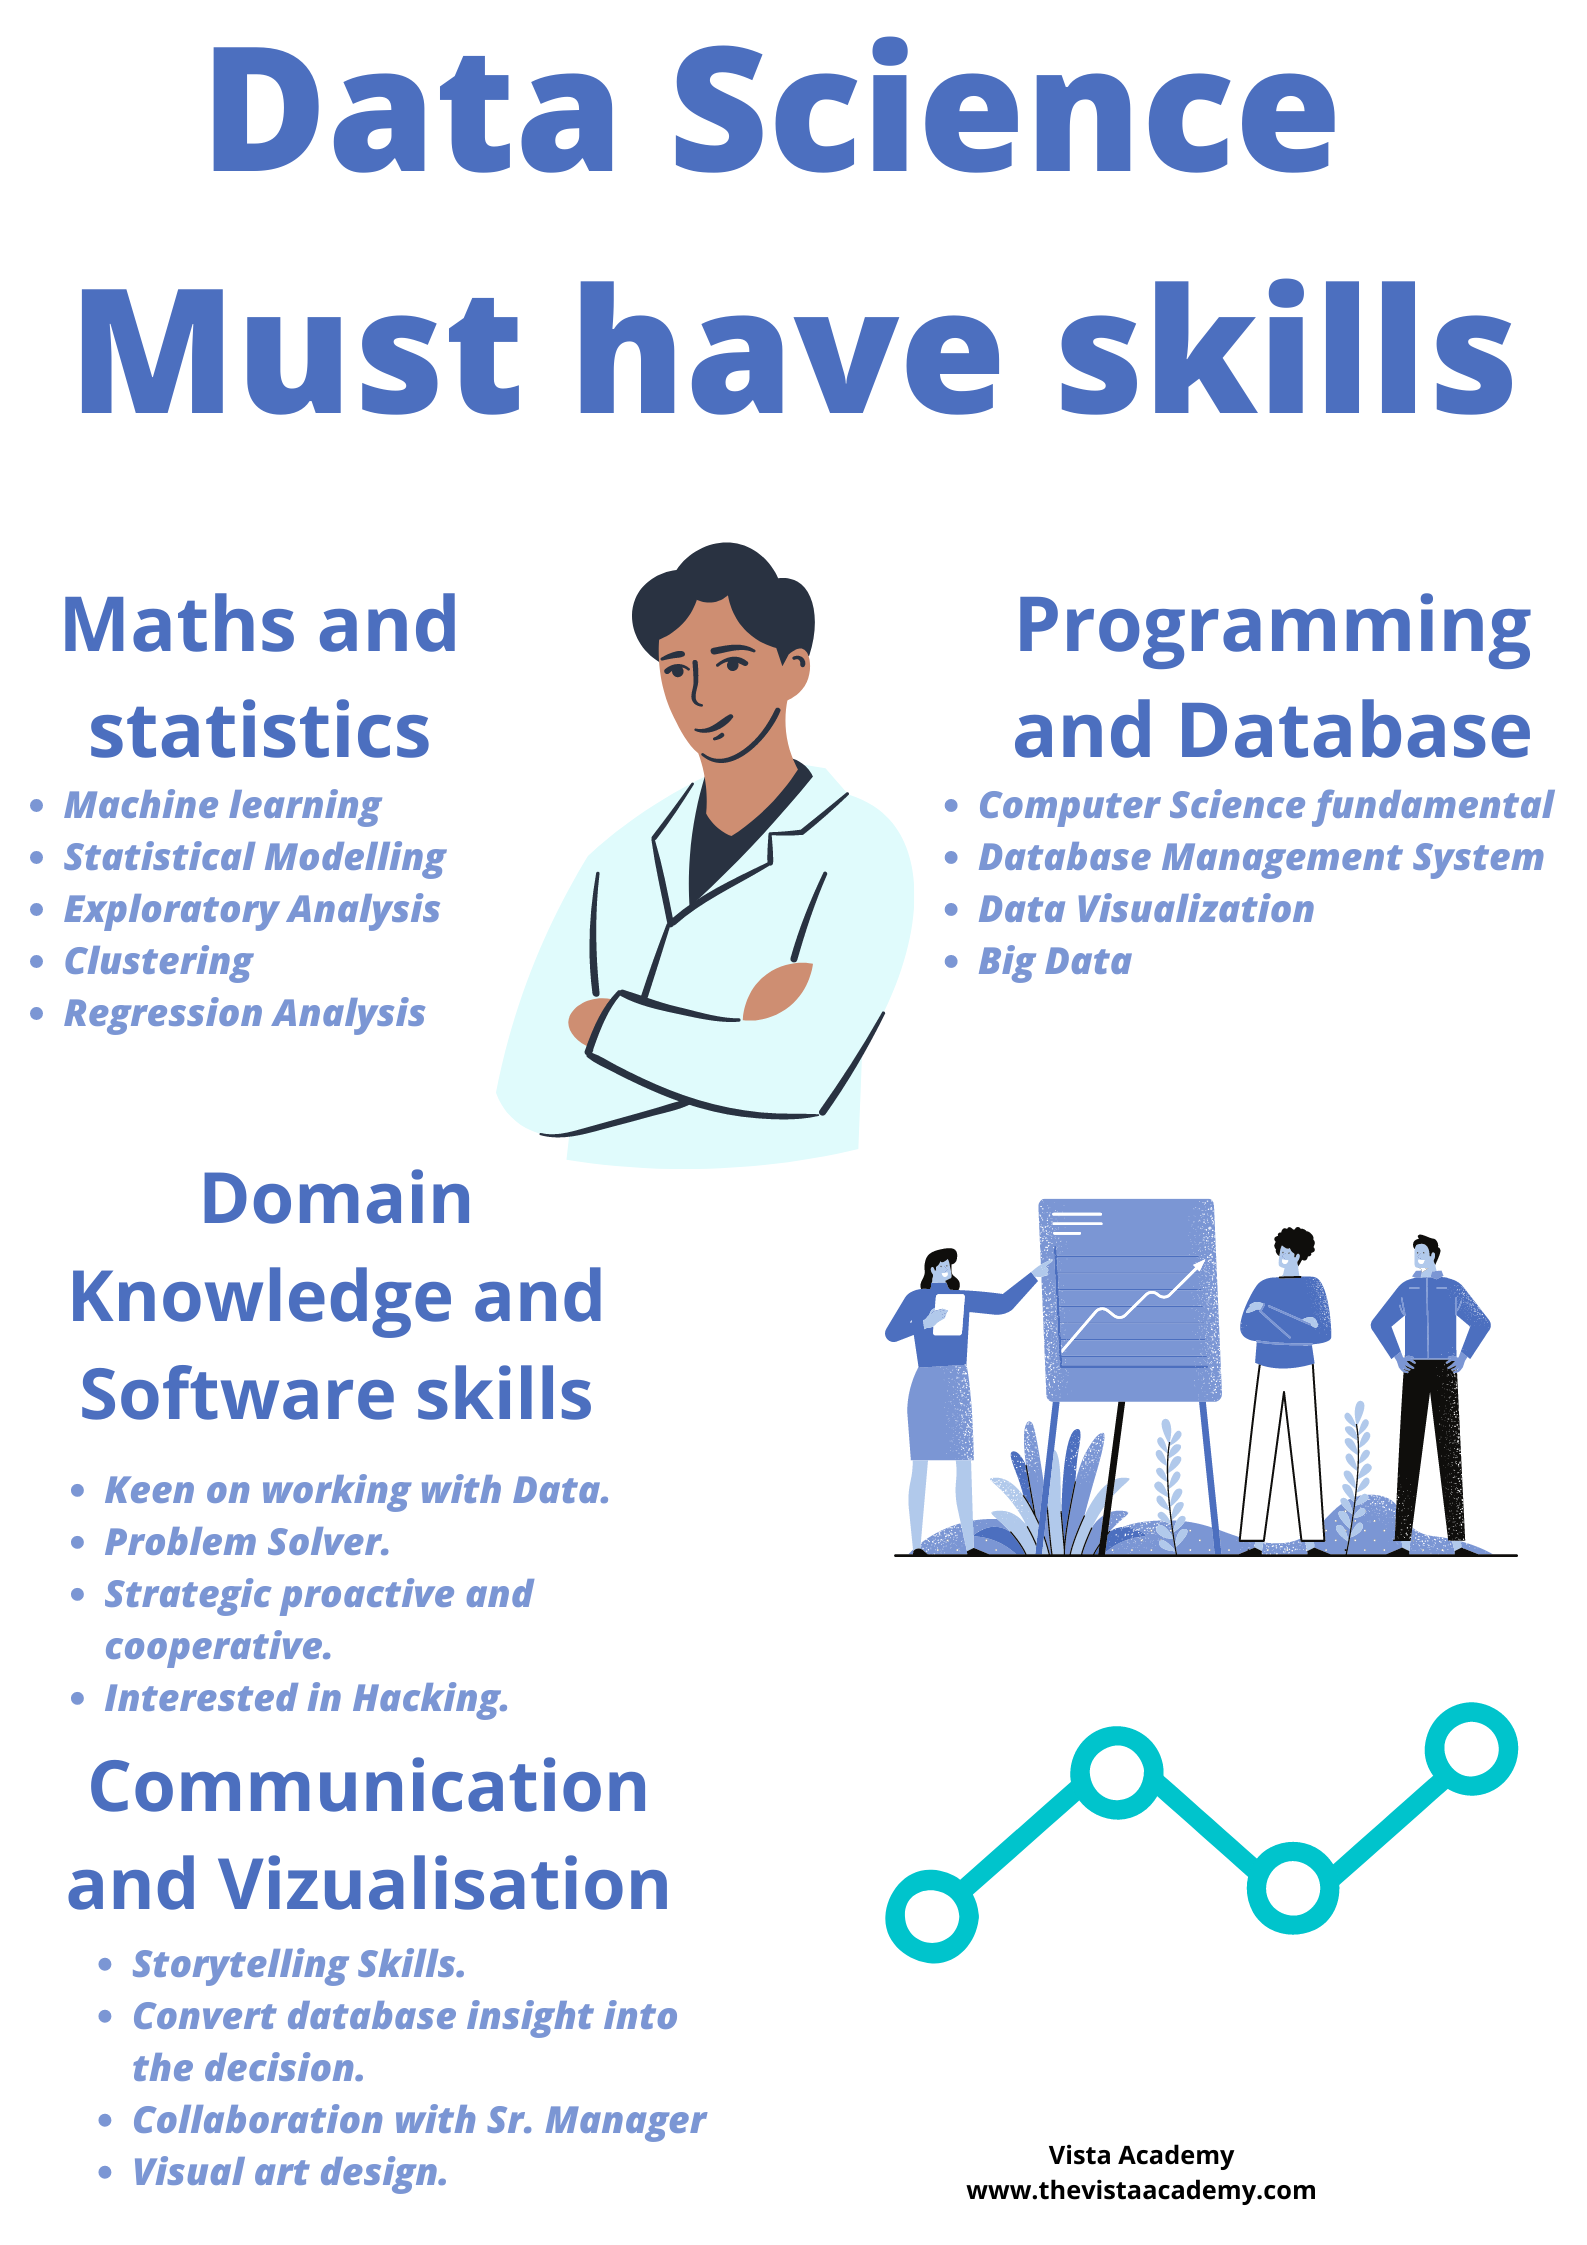
Data science skills 2025: Python, SQL, Machine Learning and visualization

โš™๏ธ Technical Skills

These are the backbone of Data Science: Python, SQL, R, Machine Learning, and Data Visualization. Without these tools, you canโ€™t clean, analyze, or model data effectively.

๐Ÿ“Š Mathematical & Statistical Skills

Core math concepts like Statistics, Probability, Linear Algebra, and Calculus help you build accurate ML models and interpret patterns hidden in raw data.

๐Ÿ’ก Non-Technical Skills

Data Scientists must also be great communicators, storytellers, and problem-solvers. The ability to explain insights to non-technical teams often matters as much as writing code.

๐Ÿ“Œ Quick Fact: According to industry surveys, 70% of recruiters say they prefer data scientists who combine technical coding skills with strong communication & business understanding.

๐Ÿ”‘ Core Technical Skills Required for Data Scientists

๐Ÿ Python

Python is the go-to language for data science because of its simplicity, readability, and powerful libraries. It supports the entire workflow โ€” from data collection to model deployment.

  • Pandas, NumPy: Data manipulation & numerical computing
  • Scikit-learn, TensorFlow: Machine learning algorithms
  • Matplotlib, Seaborn: Stunning visualizations

๐Ÿ“Š R

R is designed for statistics & data visualization. Itโ€™s popular in research, healthcare, and finance where statistical accuracy is critical.

  • ggplot2: High-quality charts & plots
  • dplyr, tidyr: Data wrangling & preparation
  • Tidyverse: End-to-end data science suite

๐Ÿ—„๏ธ SQL

SQL is essential for working with relational databases. It helps data scientists extract, filter, and aggregate data effectively.

  • SELECT: Retrieve data
  • JOIN: Combine datasets
  • GROUP BY: Aggregate & summarize data

๐ŸŒ Domain Knowledge for Data Scientists

A great data scientist doesnโ€™t just code โ€” they understand the industry context. Domain knowledge makes insights relevant, actionable, and trusted.

๐Ÿฅ Healthcare

Medical terms, patient care, and regulations guide accurate healthcare analytics.

๐Ÿ’ฐ Finance

Markets, risk management, and investments drive financial models.

๐Ÿ›’ Retail

Consumer behavior, supply chains, and sales trends inform retail analytics.

๐Ÿญ Manufacturing

Production processes and quality control support operational improvements.

๐Ÿ“˜ How to Build Domain Knowledge

  • Formal Education: Specialized degrees or certifications
  • Projects: Hands-on experience in chosen industry
  • Networking: Connect with domain experts
  • Continuous Learning: Read industry journals & attend webinars

โœ… Bottom Line: Combining technical skills with strong domain expertise makes a data scientist truly invaluable.
“`

๐Ÿงฑ Extraction, Transformation & Loading (ETL) for Data Science

ETL is the backbone of a reliable data pipeline. It pulls data from multiple sources, cleans and reshapes it, then loads it into analytics-friendly storage (warehouse/lake) so your models and dashboards stay accurate, fast, and trustworthy.

Why ETL Matters in Data Science

  • Data Quality: Cleansing & validation reduce noise โ†’ more reliable models and insights.
  • Unified View: Combines APIs, databases, flat files into one analytics-ready dataset.
  • Efficiency: Automation cuts manual work and human error.
  • Scalability: Batch/stream pipelines grow with your volume & velocity.

The ETL Process (3 Clear Steps)

1) Extraction

Pull data from databases (PostgreSQL, MySQL), APIs, CSV/Parquet, CRM/ERP, or web scraping. Expect both structured and unstructured formats.

2) Transformation

  • Cleansing: dedupe, fix types, handle nulls
  • Normalization: standardize schemas/units
  • Aggregation: rollups for analysis
  • Enrichment: join reference/master data

3) Loading

Store in a warehouse (BigQuery, Snowflake, Redshift) or data lake (S3, ADLS) with partitioning & indexing for fast queries.

๐Ÿ” ETL vs ELT: In ELT, you load first into the warehouse/lake and then transform using its compute (e.g., dbt in Snowflake/BigQuery). ELT is common for modern, cloud-native analytics; classic ETL remains great for strict data quality before loading.

Popular ETL / Pipeline Tools

๐Ÿงฉ Apache Airflow โ€“ workflow orchestration
๐Ÿงฑ dbt โ€“ SQL-based transformations in-warehouse
โšก PySpark/Spark โ€“ distributed transforms at scale
๐Ÿ”Œ Fivetran/Stitch โ€“ managed connectors
๐Ÿงฐ SSIS/Informatica/Talend โ€“ enterprise ETL suites
๐Ÿ Pandas โ€“ quick, code-first data prep

Best Practices for Robust Pipelines

  • Define clear SLAs: freshness, completeness, latency targets.
  • Automate: schedule/orchestrate; avoid manual steps.
  • Test & monitor: schema tests (dbt), data quality checks, alerts.
  • Version control: store SQL/transform code in Git, use CI/CD.
  • Document lineage: make sources, joins, & owners discoverable.
  • Design for scale: partitioning, incremental loads, idempotency.

โœ… Bottom line: A clean, automated ETL/ELT pipeline turns messy raw data into reliable analytics fuelโ€” powering accurate models, dashboards, and decisions.

Frequently Asked Questions (FAQ)

What is ETL and why is it important?
ETL stands for Extraction, Transformation, Loading. It collects raw data from sources, cleans and reshapes it, and stores it in analytics-friendly systems so teams can build reliable reports and models.
What is the difference between ETL and ELT?
ETL transforms data before loading it into a warehouse. ELT loads raw data first and uses the warehouse’s compute (e.g., dbt) to transform. ELT is common in cloud-native architectures.
Which tools should I learn for ETL?
Start with SQL, Pandas, and Airflow. Learn dbt for in-warehouse transformations and a cloud warehouse like BigQuery or Snowflake. Familiarity with Spark helps for large-scale processing.
ETL เค•เฅเคฏเคพ เคนเฅˆ เค”เคฐ เคฏเคน เค•เฅเคฏเฅ‹เค‚ เคฎเคนเคคเฅเคตเคชเฅ‚เคฐเฅเคฃ เคนเฅˆ?
ETL เค•เคพ เคฎเคคเคฒเคฌ เคนเฅˆ Extraction (เคจเคฟเค•เคพเคธเฅ€), Transformation (เคฐเฅ‚เคชเคพเค‚เคคเคฐเคฃ), เค”เคฐ Loading (เคฒเฅ‹เคกเคฟเค‚เค—)เฅค เคฏเคน เค•เคšเฅเคšเฅ‡ เคกเฅ‡เคŸเคพ เค•เฅ‹ เคธเฅเคฐเฅ‹เคคเฅ‹เค‚ เคธเฅ‡ เคฒเฅ‡เค•เคฐ เคธเคพเคซเคผ เค”เคฐ เคธเค‚เคฐเคšเคฟเคค เค•เคฐเค•เฅ‡ เคเคจเคพเคฒเคฟเคŸเคฟเค•เฅเคธ-เคซเฅเคฐเฅ‡เค‚เคกเคฒเฅ€ เคธเฅเคŸเฅ‹เคฐเฅเคธ เคฎเฅ‡เค‚ เคฐเค–เคคเคพ เคนเฅˆ เคคเคพเค•เคฟ เคฐเคฟเคชเฅ‹เคฐเฅเคŸ เค”เคฐ เคฎเฅ‰เคกเคฒ เคตเคฟเคถเฅเคตเคธเคจเฅ€เคฏ เคนเฅ‹เค‚เฅค
ETL เค”เคฐ ELT เคฎเฅ‡เค‚ เค•เฅเคฏเคพ เค…เค‚เคคเคฐ เคนเฅˆ?
ETL เคฎเฅ‡เค‚ เคกเฅ‡เคŸเคพ เค•เฅ‹ เคฒเฅ‹เคก เค•เคฐเคจเฅ‡ เคธเฅ‡ เคชเคนเคฒเฅ‡ เคฌเคฆเคฒเคพ เคœเคพเคคเคพ เคนเฅˆเฅค ELT เคฎเฅ‡เค‚ เคกเฅ‡เคŸเคพ เคชเคนเคฒเฅ‡ เคฒเฅ‹เคก เค•เคฟเคฏเคพ เคœเคพเคคเคพ เคนเฅˆ เค”เคฐ เคซเคฟเคฐ เคตเฅ‡เคฏเคฐเคนเคพเค‰เคธ เค•เฅ€ เค•เค‚เคชเฅเคฏเฅ‚เคŸเคฟเค‚เค— เคถเค•เฅเคคเคฟ เค•เคพ เค‰เคชเคฏเฅ‹เค— เค•เคฐเค•เฅ‡ เคฌเคฆเคฒเคคเฅ‡ เคนเฅˆเค‚ (เคœเฅˆเคธเฅ‡ dbt)เฅค เค•เฅเคฒเคพเค‰เคก-เค†เคงเคพเคฐเคฟเคค เค†เคฐเฅเค•เคฟเคŸเฅ‡เค•เฅเคšเคฐ เคฎเฅ‡เค‚ ELT เคธเคพเคฎเคพเคจเฅเคฏ เคนเฅˆเฅค
เค•เฅŒเคจ เคธเฅ‡ เคŸเฅ‚เคฒ เคธเฅ€เค–เคจเฅ‡ เคšเคพเคนเคฟเค?
เคถเฅเคฐเฅ‚ เค•เคฐเคจเฅ‡ เค•เฅ‡ เคฒเคฟเค SQL, Pandas, เค”เคฐ Airflow เคธเฅ€เค–เฅ‡เค‚เฅค dbt เค”เคฐ เค•เฅ‹เคˆ เค•เฅเคฒเคพเค‰เคก เคตเฅ‡เคฏเคฐเคนเคพเค‰เคธ (BigQuery/Snowflake) เค•เคพ เคœเฅเคžเคพเคจ เค‰เคชเคฏเฅ‹เค—เฅ€ เคนเฅˆเฅค เคฌเคกเคผเฅ‡ เคกเฅ‡เคŸเคพ เค•เฅ‡ เคฒเคฟเค Spark เคธเฅ€เค–เคจเคพ เคซเคพเคฏเคฆเฅ‡เคฎเค‚เคฆ เคนเฅ‹เค—เคพเฅค

๐Ÿงน Data Wrangling & ๐Ÿ”Ž Data Exploration in Data Science

Before building models, every Data Scientist must clean, transform, and explore raw datasets. These steps ensure accuracy, quality, and trust in the insights that follow.

What is Data Wrangling?

Also known as data munging, wrangling means turning messy raw data into a structured, analysis-ready format. Key steps include:

  • Cleaning: Fix inaccuracies, outliers, and missing values.
  • Transformation: Normalize, filter, and aggregate datasets.
  • Merging: Combine multiple sources into a single table.
  • Validation: Ensure consistency and data integrity.

Why Data Wrangling Matters

  • โœ”๏ธ Improves Quality: Removes errors for accurate analysis.
  • โœ”๏ธ Speeds Up Analysis: Prepped data saves hours later.
  • โœ”๏ธ Builds Reliability: Clean datasets build stakeholder trust.

What is Data Exploration?

Exploration is about understanding the story hidden in data using statistics & visuals. Itโ€™s the first chance to spot trends, anomalies, and relationships.

  • Descriptive Stats: Mean, median, variance โ†’ distribution view.
  • Visualizations: Histograms, scatter plots, boxplots.
  • Correlation Checks: Spot variable relationships & dependencies.

Why Data Exploration Matters

  • ๐Ÿ” Reveals Trends: Identifies hidden insights early.
  • ๐Ÿงญ Guides Modeling: Shapes feature selection & hypotheses.
  • ๐Ÿง  Deepens Understanding: Builds intuition about the dataset.

Best Practices for Wrangling & Exploration

  • Know Your Data: Understand source, purpose, and context first.
  • Use the Right Tools: Pandas/Numpy (Python), dplyr (R).
  • Document Everything: Keep transformations transparent & reproducible.
  • Visualize Early: Catch anomalies before modeling.
  • Handle Missing Data: Apply deletion or imputation strategically.

โœ… Bottom line: Data wrangling + exploration = the foundation of trustworthy analytics. Without these steps, even the most advanced ML models will fail.

๐ŸŽ™๏ธ Communication & ๐Ÿ“Š Data Visualization in Data Science

Great data science isnโ€™t just about models โ€” itโ€™s about storytelling. Clear communication and strong visualizations help stakeholders grasp insights quickly and make confident decisions.

Why Communication Matters

  • Bridge the gap: Translate technical output into business impact.
  • Data storytelling: Present context โ†’ insight โ†’ action with a clear narrative arc.
  • Drive alignment: Facilitate cross-functional decisions with crisp summaries.
  • Influence strategy: Tie findings to KPIs, revenue, cost, risk, or CX outcomes.

The Role of Data Visualization

  • Clarity: Make patterns, trends, and outliers obvious.
  • Engagement: Visuals hold attention better than tables alone.
  • Interactivity: Filters & drilldowns unlock deeper understanding.
  • Tooling: Tableau, Power BI, Looker; Pythonโ€™s Matplotlib/Seaborn/Plotly.

Quick Chart Picker (What to Use When)

Compare categories: Bar / Stacked Bar
Time trends: Line / Area
Distribution: Histogram / Boxplot / Violin
Relationships: Scatter / Bubble
Part-to-whole: 100% Stacked Bar (avoid pie if many slices)
Anomalies: Control charts / Highlighted scatter

Best Practices for Communication & Visualization

  • Know your audience: Executive summary โ‰  analyst deep-dive.
  • Simplify: Remove chartjunk; label directly; keep decimals sensible.
  • Consistent scales/colors: Avoid misleading axes; use color sparingly.
  • Tell the โ€œso whatโ€: Always end with recommended action or next step.
  • Iterate with feedback: Share drafts; refine titles and annotations.

โœ… Bottom line: Clear narrative + right chart = faster decisions & stronger impact.

๐Ÿค– Machine Learning & ๐Ÿง  Deep Learning โ€” Core Skills for Data Scientists

Machine Learning (ML) powers predictions and automation across data-driven teams. Itโ€™s a must-have for modeling, personalization, risk, and forecasting use cases.

Key ML Families

  • Supervised: Regression, Classification (KNN, Logistic, Random Forest, XGBoost)
  • Unsupervised: Clustering (K-means), Dimensionality reduction (PCA)
  • Semi-/Reinforcement: Active learning; policy optimization

Workflow

  • Train/Validation/Test split, cross-validation
  • Feature engineering & selection
  • Model training โ†’ hyperparameter tuning
  • Evaluation โ†’ deployment โ†’ monitoring

Evaluate the Right Way

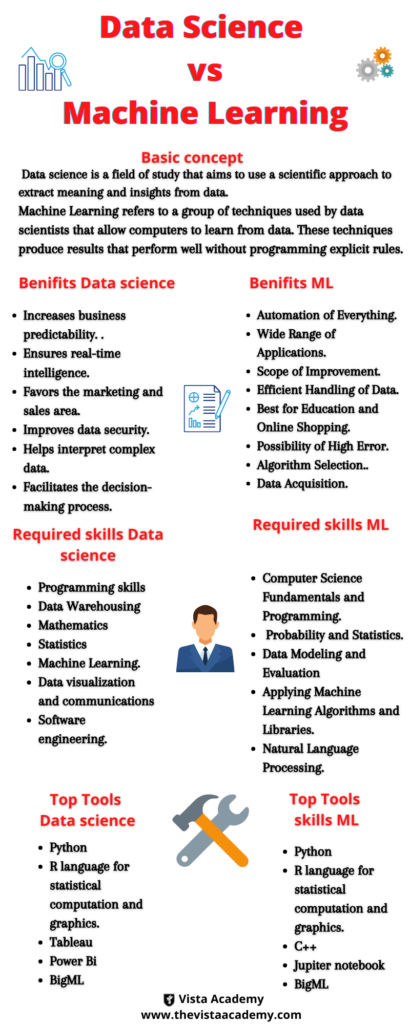
BASIC CONCEPT OF DATA SCIENCE AND MACHINE LEARNING

Data Science vs. Machine Learning

๐Ÿ“Š Big Data in Data Science

Big Data refers to datasets so large and complex that traditional tools cannot handle them. With digital growth, organizations now rely on Hadoop, Spark, and NoSQL to analyze huge data volumes and unlock new business opportunities.

โœ… Improve Decisions: Analyze customer behavior & market trends.
๐Ÿ“ˆ Predict Trends: Forecast demand, supply chains, and risks.
๐Ÿค Enhance Experience: Personalize services using omni-channel data.
โšก Optimize Ops: Spot inefficiencies and reduce costs.

๐Ÿงฉ Problem-Solving Skills for Data Scientists

Beyond tools and algorithms, a great Data Scientist is a strategic problem solver. They use data insights to address business challenges creatively and effectively.

  • Define: Understand the business context clearly.
  • Analyze: Assess what data is available and useful.
  • Model: Build predictive/ML models for solutions.
  • Evaluate: Validate, refine, and test model outcomes.
  • Communicate: Present insights clearly to stakeholders.

๐Ÿš€ Benefits of Data Science & Machine Learning

Data Science + Machine Learning are transforming industries by automating tasks, enhancing decisions, and unlocking innovation.

๐Ÿง  Enhanced Decisions: Insights from trends & behaviors.
โš™๏ธ Efficiency: Automate tasks โ†’ save time & resources.
๐Ÿ“Š Predictive Analytics: Anticipate risks & opportunities.
๐Ÿ˜Š Customer Experience: Personalize for higher loyalty.
๐Ÿ’ก Innovation: Build new products & services with ML.
๐Ÿ”’ Risk Management: Predict threats & safeguard assets.

โœ… Bottom line: Big Data, Problem-Solving, and DS+ML benefits make Data Scientists indispensable in modern businesses.

โ“ Frequently Asked Questions (FAQs) โ€” Data Scientist Skills

What are the essential skills required to become a Data Scientist?

A Data Scientist must master technical skills (Python, R, SQL, Machine Learning), mathematical/statistical skills (Probability, Linear Algebra, Calculus), and non-technical skills (communication, problem-solving, domain knowledge).

Do Data Scientists need to be experts in mathematics?

Not necessarily. While Statistics, Probability, and Linear Algebra are crucial, most modern tools handle the heavy lifting. Understanding concepts and applying them practically is more important than deep theoretical math.

What non-technical skills are important for a Data Scientist?

Non-technical skills include communication, storytelling, business acumen, critical thinking, and collaboration. These skills help explain technical insights to non-technical teams and influence strategic decisions.

Why is domain knowledge important in Data Science?

Domain knowledge ensures that analysis is relevant and actionable. For example, finance requires knowledge of risk and markets, while healthcare requires understanding of patient data and compliance standards.

What are the top skills for Data Scientists in 2025?

In 2025, the top skills include Python, SQL, Machine Learning, Deep Learning, Cloud Computing, Data Visualization, and Generative AI. Soft skills like problem-solving and storytelling remain equally critical.

```html
๐Ÿ“‹ Get Course Details
```