Power Bi Wallmart Visualizing Store Sales: Patterns, Factors, and Predictive Insights

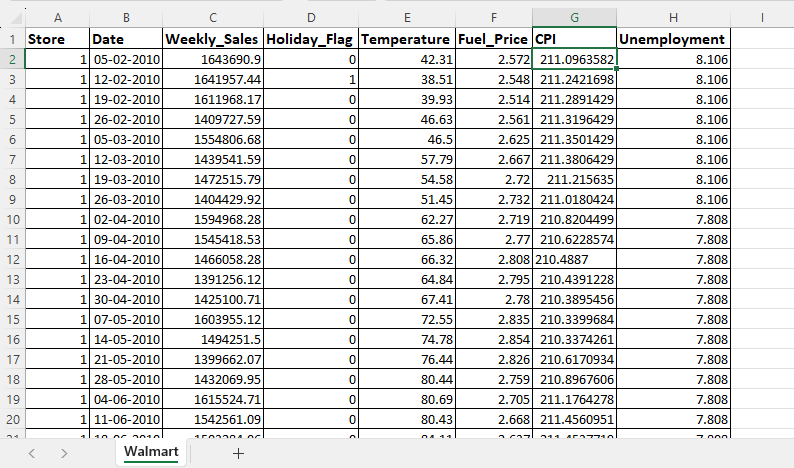
In the above data set we will solve following quesion ?
- How do weekly sales differ between shops?
- What are the overall historical patterns in sales? Are sales rising, falling, or staying the same?
- What effect do holidays have on weekly sales? During the weeks approaching holidays, do sales significantly increase or decrease?
- Does the temperature have an impact on weekly sales? Do fluctuations in temperature tend to boost or hurt sales?
- Is there any relationship between fuel prices and weekly sales? Do higher fuel prices affect consumer spending patterns?
- How do weekly sales and the Consumer Price Index (CPI) relate? Do increases in the CPI cause observable changes in sales?
- Is there a relationship between weekly sales and the unemployment rate? Do rising unemployment rates and lower sales go hand in hand?
Do sales follow any definite seasonal patterns? - Do some seasons usually see higher or lower sales?
- an sales data be segmented by store attributes such as location or store size to identify any specific trends or patterns?
- Can predictive models be developed to forecast future sales based on historical sales data and external factors?
These questions will provide as a starting point for the analysis and study of the dataset, revealing trends, patterns, and insights about the effectiveness of sales and the effects of outside factors on sales.

