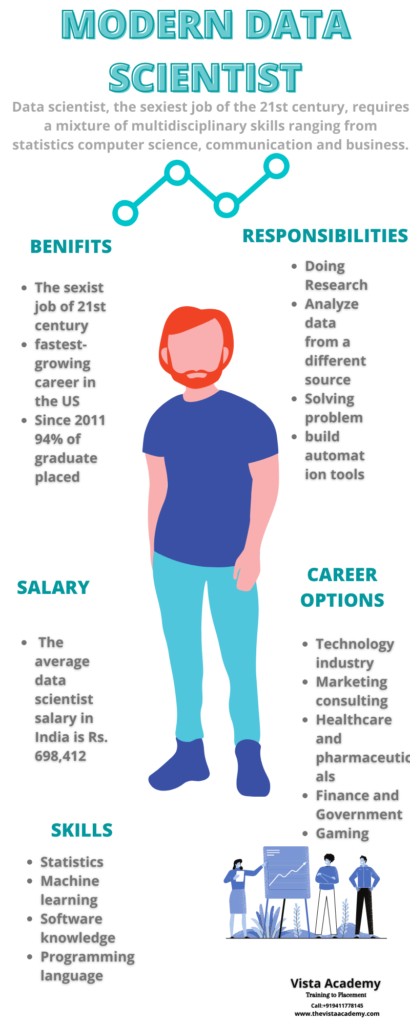
What is data science role and responsibility of data scientist ?
what is data science ?
Data Science is “about using various techniques, algorithms to analyze large amounts of both structured or unstructured data, to extract useful data, thus applying them in various business domains.
Data science combines the scientific method, mathematics and statistics, specialized programming, advanced analytics, AI, and even storytelling to tell and understand the business insights buried in data.
Data preparation may involve cleaning, collecting, and manipulating it to be ready for specific types of processing. Analysis requires the development and use of algorithms, analytics and AI models.
Why are data scientists in demand?
Why are data scientists in demand?
Data is being generated on a massive scale day by day and to process such large data sets, large firms, companies can extract valuable data from these data sets with deep access data and use them for various business strategies, models. Looking for good data scientists to do
How does data science work?
How does data science work?
Data science involves the proficiency of disciplines and areas of expertise to produce a comprehensive, complete and clean data set in raw data. Data scientists must be proficient in everything from data engineering, mathematics, statistics, advanced computing and visualization to effectively create exhaustive and clear data from a tangled medium of information and extract only the most important information that is most important. Help drive innovation and efficiency.
Data scientists also rely heavily on artificial intelligence, particularly machine learning and its subfields of deep learning, to build models and make predictions using algorithms and other techniques.
Data Science Tools
Learn python
The first and foremost step towards data science should be a programming language (ie Python). Python is the most common coding language, used by most data scientists, because of its simplicity, versatility, and being pre-equipped with powerful libraries (such as NumPy, SciPy, and Pandas) in data analysis and other aspects of data analysis. is useful. Science. Python is an open-source language and supports various libraries.
Statistics
If Data Science is a language, then Statistics is basically grammar. Statistics is basically a method of analysis, interpretation of large data sets. When it comes to data analysis and insight gathering, statistics are just as remarkable as the wind for us. Statistics help us understand the hidden details from large datasets.
Data storage
This is one of the important and important steps in the field of data science. This skill includes knowledge of various tools for both importing data from local systems, such as CSV files, and scraping data from websites, using the Beautiful Soup Python library. Scraping can also be API-based. Data collection can be managed in Python with knowledge of the query language or ETL pipelines.
Data cleaning
This is the stage where most of the time is being spent as a data scientist. Data cleaning is suitable for obtaining, working and analyzing data from the raw form of the data by removing unwanted values, missing values, categorical values, outliers and incorrectly submitted records.
Data cleaning is very important as real world data is messy and achieving this with the help of various Python libraries (Pandas and NumPy) is really important for an aspiring data scientist.
Machine learning model
Machine learning models are the way by which you integrate machine learning models into an existing production environment to make practical business decisions based on data.
machine learning
Machine learning is the idea that computers can learn from examples and experience, without being explicitly programmed to do so. Instead of writing code, you feed data to the generic algorithm, and it builds logic based on the data given.
For example, one type of algorithm is a classification algorithm. It can keep data in different groups. Classification algorithms used to detect handwritten letters can also be used to classify emails into spam and non-spam.
Real world test
After deployment, the machine learning model should be tested and validated to check its effectiveness and accuracy. Testing is an important step in data science to keep the efficiency and effectiveness of ML models under control.
The various benefits of Data Science are as follows
1. It is in demand
Data science is in great demand. Potential job seekers have many opportunities. It is the fastest growing job on LinkedIn and is predicted to create 11.5 million jobs by 2026. This makes data science a highly employable job field.
2. Excess of posts
There are very few people who have the required skill-set to become a complete data scientist. This makes Data Science less saturated as compared to other IT sectors.
Hence, Data Science is a very abundant field and has a lot of opportunities. The field of data science is high in demand but low in supply for data scientists.
3. A Highly Paying Career
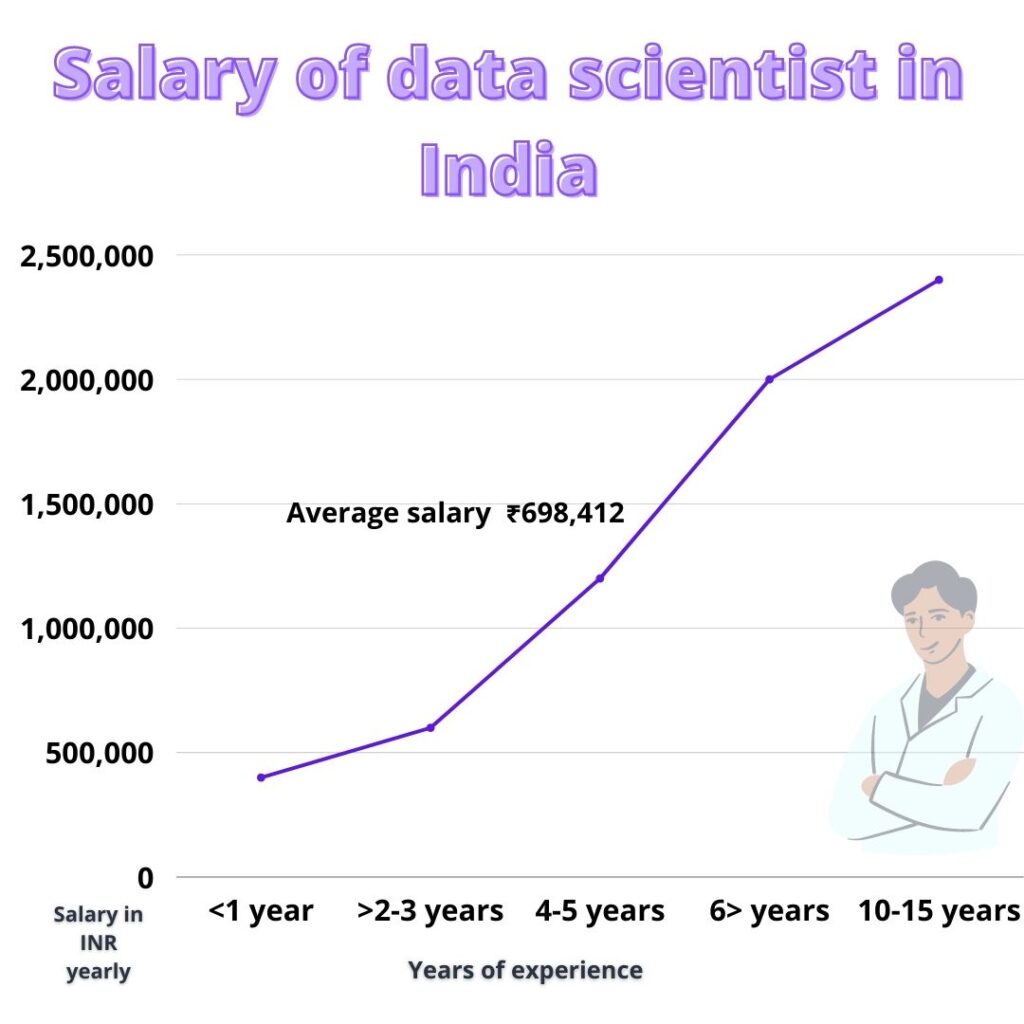
Data Science is one of the highest paying jobs. According to Glassdoor, data scientists earn an average of $116,100 per year. This makes data science a highly lucrative career option.
4. Data Science is Versatile
There are many applications of Data Science. It is widely used in healthcare, banking, consulting services and e-commerce industries. Data Science is a very versatile field. So you will get opportunity to work in different sectors.
5. Data Science Makes Data Better
Companies need skilled data scientists to process and analyze their data. They not only analyze the data but also improve its quality. Hence, Data Science is concerned with enriching the data and making it better for your company.
6. Data Scientists Are Highly Reputable
Data scientists allow companies to make better business decisions. Companies rely on data scientists and use their expertise to provide superior results to their customers. This gives data scientists an important position in the company.
7. No more boring tasks
Data Science has helped various industries to automate redundant tasks. Companies are using historical data to train machines to perform repetitive tasks. It has simplified the difficult tasks previously done by humans.
8. Makes Data Science Products Smart
Data Science involves the use of machine learning that has enabled industries to create better products specifically tailored to customer experiences.
9. The Data-Powered Adventure Begins
Hey there, curious minds! Imagine having the power to predict the future, solve mysteries, and make smarter decisions, all with the help of data. That’s the enchanting world of Data Science! Buckle up, because we’re about to embark on a journey that will open your eyes to the incredible benefits of this magical field.
10 Explore the Unknown: Discover Hidden Patterns
Have you ever wondered how Netflix knows exactly what shows you’ll love? Or how your phone’s GPS finds the fastest route? It’s all thanks to Data Science. This wizardry involves digging into piles of data (numbers, pictures, words) to uncover patterns that even the sharpest human minds might miss. Think of it as a treasure hunt for insights!
11. Predicting the Future: Your Crystal Ball Upgrade
What if I told you that Data Science can predict if it will rain tomorrow, or which new gadget will become the next big thing? By analyzing past data, we can predict future events with impressive accuracy. Farmers use it to know when to plant crops, and doctors use it to predict disease outbreaks. It’s like getting a glimpse into the future!
12. Machines with Brains: Making Computers Smart
Remember R2-D2 from Star Wars? Data Science turns computers into brainy sidekicks! With the magic of algorithms (fancy recipes for solving problems), we can teach computers to learn from data and make decisions. Self-driving cars, virtual assistants like Siri, and even robots on Mars owe their smarts to Data Science.
13. Solving Mysteries: Data Detectives at Work
Imagine you’re a detective solving a crime. Data Science helps real-life detectives too! By analyzing clues like fingerprints, security camera footage, and witness statements, they can catch the bad guys. Data Scientists use similar skills to solve mysteries hidden within data, helping businesses find out what customers want or even preventing diseases.
14.Skyrocketing Success: From Startups to Space Missions
Have you heard of SpaceX? They used Data Science to make rockets more reliable and less expensive. But it’s not just for space enthusiasts. From designing cool video games to helping farmers grow better crops, Data Science is everywhere. Startups use it to understand their customers, while big companies use it to improve products and services.
15. Changing the World:
Making a Difference Imagine if we could predict earthquakes or stop endangered species from going extinct. Data Science is lending a hand to save our planet. By analyzing data from sensors placed deep in the ground or on animals, scientists can make the world a safer and better place for all living things.
16. Your Journey Begins: Becoming a Data Wizard
Now that you know the secrets of Data Science, do you want to be a part of this adventure? Learning about data analysis, statistics, and coding is like learning spells to unlock the magic. As a Data Wizard, you could shape the future, tackle mysteries, and create innovations that will astonish the world!
17. Conclusion: Embrace the Data-Driven Future
So, young explorers, the realm of Data Science is yours to conquer! Remember, every time you ask a question, play a game, or even post a picture, you’re generating data. And with the power of Data Science, that data can become a force for incredible change. Embrace the magic, keep asking questions, and who knows what you might discover next?
Common Data Scientist Job Titles
Data Scientist: The Insight Explorer
Imagine you’re a detective of data. You sift through information like Sherlock Holmes, uncovering hidden connections and building magic algorithms that predict the future. You’re the brain behind making decisions smarter and helping businesses see beyond the obvious.
2. Data Analyst: The Data Detective
You’re like a data detective. Imagine you’re Sherlock Holmes, but instead of solving crimes, you solve business puzzles. You dive into huge piles of data, sort through them, and reveal secrets hidden within. Your findings guide companies on what moves to make next.
3. Data Engineer: The Data Organizer
Picture yourself as a data organizer. You’re like a librarian for data – you collect, clean, and neatly arrange information from different sources. Think of it as building the foundation for data scientists and analysts to work their magic.
4. Business Intelligence Specialist: The Trend Spotter
Imagine you’re a trend spotter for businesses. You’re like a fashion guru, but for data trends. You analyze data sets to find patterns that guide companies towards the hottest trends in the market. Your insights make sure businesses are always one step ahead.
5. Data Architect: The Blueprint Designer
You’re an architect, but instead of buildings, you design the data structures that hold a company’s information. Just like an architect plans a house, you create the blueprint for how data flows, making sure it’s efficient, organized, and ready for action.
Remember, these roles are like pieces of a puzzle that come together to transform raw data into goldmine insights. Whether you’re building algorithms, spotting trends, or designing data structures, you’re the hero behind the scenes making businesses smarter, sharper, and ready for whatever the future holds!
Experts are heavily preferred over the general data scientist
In the data science and analytics community, experts are heavily preferred over the general data scientist – that’s just the way. We naturally believe that in some role
Or more expertise is a sure way to guarantee success for a business outcome. Unfortunately, it’s not that easy. While experts are excellent at reconstruction work, their
well practiced,
WHAT IS THE FUTURE OF DATA SCIENCE IN 2023
Data Science is foundation for machine learning and AI.
Jobs in data science are predicted to increase by 30%, according to an IBM analysis. In 2023, there will be an anticipated 2,720,000 employment openings for data scientists. Additionally, the US Bureau of Labour Statistics predicts that by 2026, 11 million new employment would have been generated.
Every business seeks to maximise earnings. Every sector has realised that it needs data scientists to play with data in order to maximise corporate profitability since data is the main component of data science. The need for careers in data science is due to this.
All of this makes it clear that the finest occupations in the world today are those of data scientists, analysts, engineers, or business analysts.
Additionally, data is providing a wealth of opportunities for data scientists in all significant public and private sectors worldwide. We will now examine the industries where employment in data science might be produced in 2023.
Data scientist role and responsibilities
- Data Analytics and Exploration.
- Machine Learning and Statistical Modelling.
- Data Visualization
- Predictive Modeling and Forecasting
The Data Detective: Investigating Insights
Imagine you’re a detective in a data world. Your mission? To dig deep into mountains of data and find hidden treasures. Data Scientists do just that! They collect, clean, and organize data like puzzle pieces. Then, using their magical magnifying glass (also known as algorithms), they uncover patterns that help businesses make better decisions.
Fortune Telling with Numbers: Predicting the Future
Ever heard of predicting tomorrow’s weather or the next big trend? Data Scientists do it all! By analyzing past data, they create crystal balls of algorithms that forecast what might happen next. Just like wizards foreseeing future events, Data Scientists help companies prepare for what’s coming, whether it’s stocking up on umbrellas or crafting the next hit product.
Teaching Computers to Think: Machine Learning Maestros
Imagine having a pet robot that learns tricks from you. That’s what Data Scientists do with computers! They teach machines to learn from data, so the machines can do things on their own. From suggesting songs you’ll like to helping doctors diagnose diseases, Data Scientists make computers super smart.
Storytellers of Data: Creating Visual Magic
Remember your favorite storybook with captivating pictures? Data Scientists are like modern-day storytellers, but with data. They turn boring numbers into stunning visuals, like colorful graphs and interactive charts. This makes it easier for everyone to understand the story the data is telling.
Business Wizards: Advising and Innovating
Imagine you own a magical store, and you want to know which items your customers love the most. Data Scientists help businesses with exactly that! They analyze data to reveal what customers want, so businesses can make products that people can’t resist. They’re also the brains behind new inventions and improvements, making the world a more exciting place.
Making a Better World: Solving Big Problems
Ever thought about saving the planet with data? Data Scientists are on it! They work on things like predicting earthquakes, stopping pollution, and even curing diseases. By crunching data numbers, they create solutions that have the power to change the world for the better.
Becoming a Data Hero: Your Journey Begins
Ready to join the Data Scientist league? Start by learning about numbers, coding, and the magic of statistics. With the right skills, you could be the one making apps that recognize your voice or helping farmers grow more food. The world is your playground, and data is your key to unlocking its secrets!
Real-World Adventures:
Imagine you work for an online store. By digging into data about what people buy and when they buy it, you might discover that customers tend to buy more winter coats when the temperature drops. This could lead to a “Winter Coat Sale” exactly when people are ready to shop for warmth. And just like that, you’ve helped boost sales and keep customers happy!
Problem Solving Guru:
Imagine you’re helping a healthcare company. They want to figure out if a new drug they’re developing is effective. You’ll use historical patient data to see if the drug really makes a difference. This is like solving a jigsaw puzzle, but with numbers and facts!Customer Secrets:
Imagine you’re helping an online streaming service. They want to know what shows people like the most. By analyzing viewing habits and ratings, you can reveal which genres and actors are most popular. This helps the service recommend shows that people are likely to love.
Finding Hidden Gold in Data:
You’re a modern-day prospector, sifting through data to find nuggets of gold. Let’s say you’re working with a transportation company. By analyzing travel patterns and routes, you can suggest more efficient routes that save time, fuel, and money.
Conclusion: Embrace Your Inner Data Wizard
So, brave souls, Data Science might sound like a complex spell, but it’s really about making sense of the digital universe. Every click, every like, every step you take online generates data. And with Data Scientists on the case, this data becomes a powerful tool to shape the world. So, don your cape, grab your coding wand, and let the data adventures begin!
Data analysis and exploration
Large and complex datasets will be gathered, cleaned, and preprocessed by you. Exploratory data analysis (EDA) is used in this to comprehend the data, spot trends, and derive insights.
1. Data Cleaning and Preprocessing:
Data scientists often work with large and complex datasets that may contain missing values, outliers, or inconsistencies. They perform data cleaning tasks to ensure the data is accurate, consistent, and ready for analysis. This involves handling missing data, removing outliers, resolving inconsistencies, and transforming data into a suitable format.
2, Exploratory Data Analysis (EDA):
EDA involves examining and summarizing the main characteristics of the data. Data scientists use various statistical techniques and visualization tools to understand the data’s categorizing , identify patterns, detect anomalies, and uncover relationships between variables. EDA helps to generate hypotheses, guide feature selection, and inform subsequent modeling decisions.
3. Statistical Analysis:
Data scientists apply statistical techniques to gain insights from the data. They use descriptive statistics to summarize and describe the data, inferential statistics to make inferences and draw conclusions about the population based on sample data, and hypothesis testing to validate assumptions and test relationships between variables.
4. Data Visualization:
Data scientists leverage data visualization techniques to effectively communicate insights and findings. They create visual representations such as charts, graphs, and interactive dashboards to present patterns, trends, and relationships in the data. Visualizations help stakeholders understand complex information quickly and make informed decisions.
5. Feature Engineering:
Feature engineering involves creating new features or transforming existing ones to improve the performance of machine learning models. Data scientists identify relevant features, apply mathematical transformations, combine variables, or extract useful information from the data to enhance the model’s predictive power.
6. Dimensionality Reduction:
In cases where the dataset has a high dimensionality, data scientists use dimensionality reduction techniques such as principal component analysis (PCA) or t-distributed stochastic neighbor embedding (t-SNE) to reduce the number of features while preserving the most important information. This helps simplify the analysis and visualization processes.
Machine learning and Statistical Modeling

To address business issues, you will create and use a variety of machine learning algorithms and statistical models. This entails choosing the right models, developing, testing, and fine-tuning their parameters.
1 Model selection and assessment:
The right machine learning models for a specific problem must be chosen by data scientists. They take into account elements like the type of data being used, the type of problem (classification, regression, clustering, etc.), and the particular demands of the assignment.
2. Feature Selection and Engineering:
Data scientists identify the most relevant features that contribute to the predictive power of the model. They use techniques such as statistical tests, correlation analysis, and domain knowledge to select the most informative features. Additionally, they may engineer new features by transforming, combining, or extracting meaningful info.
3.Training and Fine-tuning Models:
Data scientists train machine learning models using labeled data. They split the data into training and validation sets, feed it to the model, and adjust the model’s parameters to minimize errors or optimize specific objectives. This process involves selecting appropriate algorithms, tuning hyperparameters, and utilizing techniques like cross-validation to prevent overfitting and ensure the model generalizes well to unseen data.
5. Ensemble Methods:
Data scientists often employ ensemble methods, such as random forests, gradient boosting, or stacking, to combine multiple models and improve predictive accuracy. Ensemble methods harness the diversity and complementary strengths of individual models to make more robust predictions.
6. Deep Learning:
In recent years, deep learning has gained prominence in various domains. Data scientists may work with deep neural networks for tasks such as image classification, natural language processing, or sequence prediction. They use frameworks like TensorFlow or PyTorch to design, train, and fine-tune deep learning models with large-scale datasets.
Data Visualization
In order to convey complicated findings and insights to stakeholders, you will produce visualisations and reports. This includes presenting data in an understandable way by using tools like charts, graphs, and dashboards.
1.Communicating Data:
Data visualization helps in effectively communicating complex information, patterns, and trends in a visual and intuitive manner. It enhances understanding and enables stakeholders to grasp insights quickly, facilitating decision-making processes.
2. Selecting the Right Visualizations:
Data scientists choose appropriate visualizations based on the nature of the data and the specific objectives. Common types of visualizations include bar charts, line charts, scatter plots, histograms, pie charts, heatmaps, treemaps, and network diagrams. The choice of visualization depends on the variables being analyzed, the relationships between them, and the intended message.
3.Exploratory Visualization:
Data scientists use visualizations to explore and analyze data during the exploratory data analysis (EDA) phase. They create visual representations to examine the distribution of variables, detect outliers, identify patterns, and uncover relationships between data elements. Exploratory visualizations help generate insights and guide subsequent analysis.
4.Storytelling with Data:
Data visualization is a powerful tool for storytelling. By carefully designing and arranging visual elements, data scientists can construct a compelling narrative around the data. They organize visualizations in a logical flow, highlight key findings, and emphasize the main message they want to convey.
5.Interactive Visualizations:
Interactive visualizations enable users to interact with the data and explore different aspects dynamically. Data scientists develop interactive dashboards and visualizations using tools like D3.js, Tableau, Power BI, or Python libraries such as Matplotlib, Plotly, or Seaborn. Interactivity allows users to filter, drill down, zoom in/out, and customize visualizations to gain deeper insights.
5. Geographic Visualization:
Geographic data visualization involves representing data on maps or geographical coordinates. Data scientists use techniques such as choropleth maps, bubble maps, and heatmaps to visualize spatial patterns, regional variations, and relationships between variables across different locations.
6.Temporal Visualization:
Temporal visualizations show how data changes over time. Data scientists use line charts, area charts, time series plots, or animated visualizations to explore trends, seasonality, and patterns in time-dependent data. Temporal visualizations are effective in understanding historical data, forecasting, and identifying patterns in time series data.
7.Data Dashboarding:
Data scientists create interactive dashboards that consolidate multiple visualizations and key performance indicators (KPIs) into a single interface. Dashboards provide a holistic view of the data, enabling stakeholders to monitor metrics, track progress, and make informed decisions in real-time.
Experimental design and A/B testing
Experiment: Cooking Up Curiosity
Imagine you’re in a kitchen, trying to create the perfect recipe for a delicious cake. Experimental design is just like that! Scientists and savvy businesses cook up experiments to answer questions. They mix different ingredients (or variables) and see how they affect the outcome. It’s all about turning curiosity into solid answers.
The A and the B: Let the Battle Begin
Ever had to choose between two different ice cream flavors? That’s the spirit of A/B testing! Let’s say you’re designing a website. You wonder if a blue “Sign Up” button gets more clicks than a green one. A/B testing sets up a battle: A is the blue button, and B is the green button. By comparing how people interact with both, you find out which one wins the popularity contest.
The Wizardry of Randomness: Creating Fair Tests
Imagine you’re a magician hosting a magical contest. You want to make sure everyone has an equal chance to win, right? That’s where randomness comes in! In experiments and A/B testing, we use random assignment. It’s like shuffling cards before a game. This ensures that each group (A and B) is a fair representation of the whole crowd.
Crunching the Numbers: Analyzing Results
Ever played a game and tallied up the scores to see who won? That’s exactly what happens after an experiment or A/B test. Data is collected, numbers are crunched, and voila! The winner emerges. Statisticians, who are like math detectives, help make sense of the data. They use their magic to decide if the results are reliable or just coincidental.
Hunting for Insights: Unearthing Discoveries
Imagine you’re a treasure hunter on a quest for a hidden chest of gold. In the world of experiments, data is the treasure, and insights are the gold. A/B testing helps you find out which changes work better and why. Maybe people prefer big fonts on a website or shorter videos for better attention. Insights like these guide decisions and make things awesome!
You’ll plan studies and run A/B tests to evaluate the effectiveness of various treatments or adjustments. Making data-driven judgments and evaluating the efficacy of tactics are both aided by this.
Experimental design and A/B testing are important methodologies used in data science to assess the impact of changes or interventions and make data-driven decisions. Here’s an overview of these concepts:
1. Experimental Design:
Experimental design refers to the process of planning and organizing experiments to obtain reliable and meaningful results. It involves defining research questions, identifying variables, designing treatments or interventions, and specifying the control groups. Experimental design aims to minimize bias, confounding factors, and sources of variability to ensure the validity and reliability of the experiment.
2. Treatment and Control Groups:
In experimental design, participants or subjects are divided into different groups. The treatment group receives the intervention or change being tested, while the control group does not receive the intervention and serves as a baseline for comparison. Random assignment is typically used to allocate participants to groups, ensuring that any observed differences between the groups are not due to pre-existing factors.
3. A/B Testing:
A/B testing, also known as split testing, is a specific form of experimental design used in marketing, user experience (UX), and web development. It involves comparing two versions of a webpage, advertisement, or user interface (A and B) to determine which performs better in terms of a specific metric, such as conversion rate, click-through rate, or user engagement. A random sample of users is assigned to each version, and their interactions and behavior are analyzed to determine the impact of the changes.
4 Hypothesis Testing:
In both experimental design and A/B testing, hypothesis testing is employed to determine if the observed differences between groups are statistically significant or simply due to chance. Data scientists formulate null and alternative hypotheses and use statistical tests, such as t-tests, chi-square tests, or ANOVA, to analyze the data and make inferences about the population based on the sample data.
5.Sample Size Determination:
Determining the appropriate sample size is crucial for the validity and power of an experiment. Data scientists use statistical power analysis to calculate the required sample size, taking into account the desired level of significance, effect size, and statistical power. A larger sample size generally leads to more precise and reliable results.
6.Data Collection and Analysis:
During the experiment, data scientists collect relevant data to evaluate the impact of the intervention. This may include quantitative metrics, user feedback, survey responses, or other forms of data. The collected data is then analyzed using statistical methods to assess the differences between groups and draw conclusions.
7. Drawbacks and Considerations:
Experimental design and A/B testing have certain limitations and considerations. These include potential biases, such as selection bias or sampling bias, that may affect the generalizability of the results. Data scientists need to carefully design experiments, control for confounding factors, and ensure that the observed effects are meaningful and not spurious.
Experimental design and A/B testing provide rigorous methodologies for testing hypotheses, optimizing interventions, and making data-driven decisions. They help organizations understand the impact of changes, evaluate different strategies, and continuously improve their products, services, or user experiences.
Syllabus for Data Science
Introduction to Data Science:
- Overview of data science and its applications
- Introduction to data types and data formats
- Basics of programming languages commonly used in data science (such as Python or R)
Mathematics and Statistics Foundations:
- Descriptive statistics (mean, median, mode, variance, standard deviation, etc.)
- Probability theory
Inferential statistics (hypothesis testing, confidence intervals, etc.) - Linear algebra (vectors, matrices, matrix operations)
- Calculus (differentiation, integration)
- Data Manipulation and Analysis:
Data cleaning and preprocessing
Exploratory data analysis (EDA)- Data visualization techniques
- Feature engineering
Machine Learning:
- Introduction to machine learning concepts and algorithms
- Supervised learning (linear regression, logistic regression, decision trees, random forests, support vector machines, etc.)
Unsupervised learning (clustering, dimensionality reduction, etc.)
Model evaluation and validation techniques
Deep Learning and Neural Networks:
Introduction to neural networks
- Deep learning frameworks (TensorFlow, PyTorch, etc.)
- Convolutional neural networks (CNNs) for image data
- Recurrent neural networks (RNNs) for sequential data
Big Data Technologies:
- Introduction to big data concepts
- Distributed computing frameworks (Hadoop, Spark)
- Data storage technologies (HDFS, NoSQL databases)
- Data processing and querying (MapReduce, Spark SQL)
Data Science Tools and Libraries:
- Introduction to data science libraries (NumPy, Pandas, Scikit-learn, Matplotlib/Seaborn, etc.)
- Data manipulation and analysis using Python or R
- Version control systems (Git)
- Integrated development environments (IDEs) and Jupyter notebooks
Ethical and Legal Issues in Data Science:
Data privacy and security
- Ethical considerations in data collection and analysis
- Bias and fairness in machine learning models
- Real-world Applications and Case Studies:
- Practical applications of data science in various industries (finance, healthcare, marketing, etc.)
Case studies and projects demonstrating the application of data science techniques to solve real-world problems
Capstone Project:
A substantial project where students apply their knowledge and skills to tackle a significant data science problem, often in collaboration with industry partners or mentors.
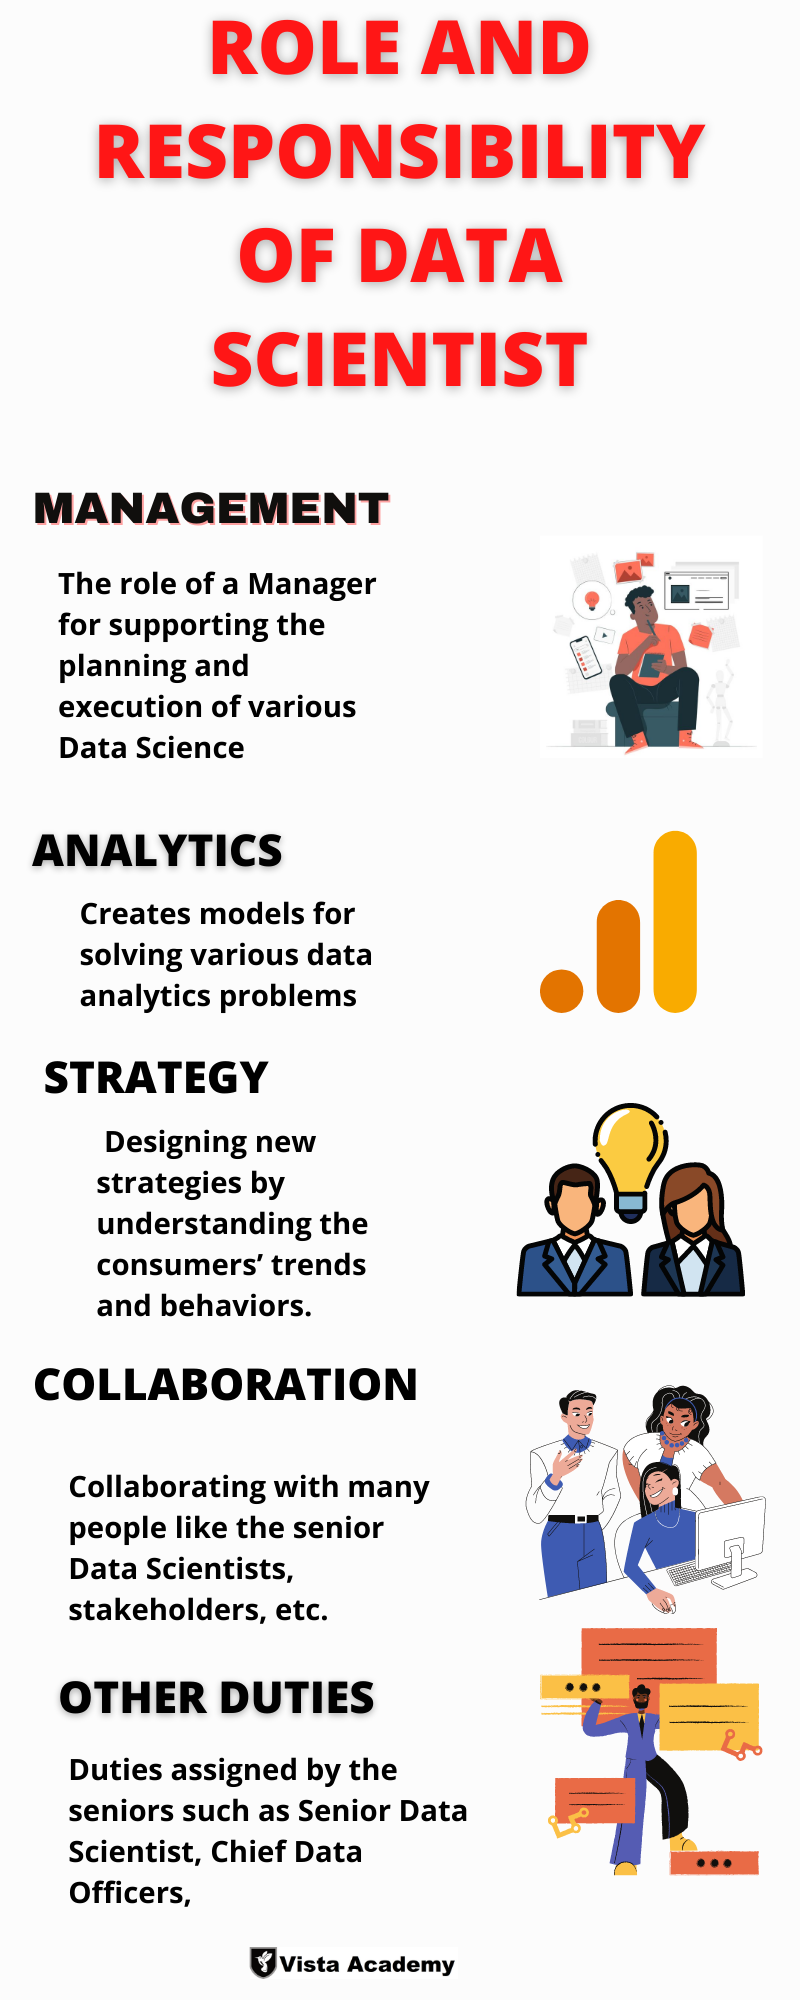
A data scientist is responsible for collecting, analyzing, and interpreting complex data to inform business decisions, solve problems, and discover insights. They use various tools and techniques to extract meaning from data and create models that can predict future trends and patterns.
Data scientists are typically responsible for tasks such as data cleaning and preprocessing, exploratory data analysis, feature engineering, model selection and training, validation, and deploying models into production. They also collaborate with domain experts and stakeholders to understand business goals and formulate data-driven solutions.
Data scientists need proficiency in programming languages like Python or R, data manipulation libraries (e.g., Pandas, NumPy), machine learning frameworks (e.g., Scikit-Learn, TensorFlow, PyTorch), and SQL for database querying. They should also be familiar with data visualization tools (e.g., Matplotlib, Seaborn) and have a solid understanding of statistics and probability.
Domain knowledge is crucial as it helps data scientists understand the context of the data they’re working with. It enables them to ask the right questions, validate results, and translate technical findings into actionable insights for business stakeholders.
Data scientists collaborate with various teams, such as business analysts, engineers, and managers. They communicate findings, explain technical concepts, and work together to align data projects with organizational goals. Collaboration ensures that data-driven decisions are well-integrated into the overall strategy.
While both roles deal with data, data scientists are more focused on building predictive and prescriptive models, often involving complex machine learning algorithms. Data analysts, on the other hand, primarily focus on descriptive analysis, creating reports, and visualizations to help organizations understand historical data and make informed decisions.
Ethical considerations are important in data science. Data scientists should handle sensitive information responsibly, ensure privacy and data protection, and avoid biases in their models. Regular audits and checks on model fairness and transparency are also essential.
The process typically involves: defining the problem, collecting and preprocessing data, exploring and analyzing the data, feature engineering, selecting an appropriate algorithm, splitting data into training/validation/test sets, training the model, tuning hyperparameters, evaluating its performance, and deploying the model into production.
Data scientists often read research papers, attend conferences (e.g., NeurIPS, ICML), participate in online forums and communities, take online courses, and follow blogs and social media accounts of experts in the field to stay updated with the latest developments.
A/B testing is a method used to compare two versions (A and B) of a webpage, app, or other digital asset to determine which one performs better in terms of user engagement or other desired metrics. Data scientists design and analyze A/B tests to make informed decisions about changes to products or services

