🏪 Walmart में AI-Driven Inventory Forecasting कैसे काम करता है?

Walmart में AI-Driven Inventory Forecasting

Walmart दुनिया का सबसे बड़ा रिटेलर है, जहाँ लाखों products रोज़ बेचे और खरीदे जाते हैं। इतना बड़े scale पर Inventory Forecasting करना आसान नहीं है। अगर demand का सही अंदाज़ा न लगाया जाए, तो या तो stock-out (सामान खत्म) हो सकता है या फिर overstock (अनावश्यक inventory) से नुकसान। यहीं पर AI और Machine Learning खेल में आते हैं।

📦 Inventory Forecasting क्या है और क्यों ज़रूरी है?

Inventory Forecasting वह प्रक्रिया है जिसमें पिछले बिक्री के आंकड़ों, मौसमी ट्रेंड, त्योहारी मांग, और ग्राहक व्यवहार को ध्यान में रखकर भविष्य में कितनी मांग होगी का अनुमान लगाया जाता है। इससे retailers को सही समय पर पर्याप्त स्टॉक सुनिश्चित करने में मदद मिलती है और व्यापार की profitability बढ़ती है।

🛠️ Walmart का AI-Powered Inventory System — कैसे काम करता है?

Walmart के पास अनगिनत stores, लाखों SKUs और real-time sales streams होते हैं — इन सबको scale पर संभालने के लिए AI, big data और automation का मिलकर उपयोग होता है। नीचे इस सिस्टम के मुख्य घटक और workflow दिए गए हैं।

📥

1. Data Sources (POS, Suppliers, IoT)

Point-of-Sale transactions, supplier lead times, warehouse telemetry, IoT shelf sensors और historical sales — ये सब raw inputs होते हैं। साथ में external signals जैसे weather, holidays और promotions भी feed होते हैं।

📊

2. Demand Forecasting (Time-Series + ML)

Walmart जैसे systems में hybrid approach common है — time-series models (ARIMA/Prophet/SARIMA) को ML models (XGBoost, RandomForest) या deep learning (LSTM, Transformer) के साथ ensemble किया जाता है ताकि seasonal, trend और promotions से प्रभावित demand accurately predict हो सके।

🔁

3. Automated Replenishment & Ordering

Forecasts से reorder points और order quantities auto-generate होते हैं। Vendor portals और warehouse systems के साथ API-led integration से replenishment workflows automate होते हैं — जिससे lead time कम और shelf availability बढ़ती है।

4. Real-Time Analytics (POS → Dashboard)

Real-time POS streams और sensor data dashboards पर दिखते हैं — Ops teams तुरंत alerts पाते हैं (e.g., sudden demand spike), ताकि fast replenishment या price/offer adjustments किए जा सकें।

🎯

5. Promotions, Pricing & Seasonality

Holiday calendars, localized festivals और marketing campaigns demand को प्रभावित करते हैं। Walmart models इन promotional effects को feature-engineer कर के forecasts में incorporate करते हैं।

📈

6. Metrics & Monitoring (MAPE, RMSE, TTL)

Model performance (MAPE, RMSE), shelf availability, stock-out frequency और inventory carrying cost को measure करके continuous improvement की जाती है। A/B tests और holdout validation routine हिस्सा होते हैं।

Technical Stack (typical)

Big Data (Spark/Hadoop), Data Warehousing, Python/R, time-series libs (Prophet, statsmodels), ML libs (XGBoost, scikit-learn), model serving (KFServing, Seldon), and monitoring (Prometheus/Grafana).

# Placeholder: Python pseudo-code to train a simple Prophet model
from prophet import Prophet
df = load_sales_data()        # ['ds','y'] format
m = Prophet(yearly_seasonality=True, weekly_seasonality=True)
m.add_regressor('is_promo')   # promotional flag
m.fit(df)
future = m.make_future_dataframe(periods=30)
forecast = m.predict(future)

(Replace with store/SKU-level pipelines and productionized infra for scale.)

ध्यान दें: बड़े डेटा systems में privacy और vendor-data governance crucial हैं — data sharing agreements, anonymization और secure pipelines must be enforced।

⏱️ Time-Series Forecasting Models — ARIMA, Prophet, LSTM और अधिक

रिटेल forecasting में सही मॉडल चुनना critical है — हर model की अपनी ताकत और limitations होती हैं। नीचे common approaches और practical tips दिए गए हैं।

📐 ARIMA / SARIMA

Classical time-series methods — ARIMA seasonal/non-seasonal patterns के लिए effective हैं जब data stationarity दिखाता है। छोटे stores या stable SKUs पर अच्छा काम करते हैं।

Good for: short-term baseline forecasts, interpretable models.

🔮 Facebook Prophet / NeuralProphet

Prophet handles seasonality, holidays और trend changes आसानी से करता है — business users के लिए tuning friendly है। promotions/holiday regressors भी जोड़ सकते हैं।

Good for: business calendars, holiday-heavy SKUs, explainability.

⚙️ Tree-based ML: XGBoost / RandomForest

Feature-engineered tabular models (lags, rolling means, promo flags, weather features) पर strong performance देते हैं। Non-linear patterns और cross-SKU features capture कर लेते हैं।

Good for: SKU-store hierarchies, cross-sectional signals.

🧠 Deep Learning: LSTM / Transformer

Multi-variate sequences और long-term dependencies handle करने के लिए LSTM/Transformer useful हैं। Large-scale cross-SKU models में transfer learning और shared encoders लाभ देते हैं।

Good for: massive datasets, complex temporal patterns.

प्रैक्टिकल सुझाव (Store/SKU level)

  • Hierarchical Forecasting: Store → Category → SKU hierarchy पर separate models + top-down या bottom-up aggregation अपनाएँ।
  • Feature Engineering: lag features, rolling averages, promo flags, holiday indicators, regional weather और price elasticity शामिल करें।
  • Ensembling: Classical time-series + ML ensemble अक्सर robust predictions देते हैं (stacking या simple average)।
  • Backtesting: Holdout windows और rolling-origin evaluation से realistic performance measure करें (MAPE, RMSE)।

Code Example: Prophet + XGBoost Hybrid (pseudo-code)

# 1) Prophet for baseline seasonality/trend
prophet_df = df[['ds','y']].copy()
m = Prophet(yearly_seasonality=True, weekly_seasonality=True)
m.add_regressor('is_promo')
m.fit(prophet_df)
future = m.make_future_dataframe(periods=30)
prophet_forecast = m.predict(future)[['ds','yhat']]

# 2) Prepare ML features (lags, rolling means, promo, weather)
ml_df = create_features(df)   # includes lag_1, lag_7, roll_7_mean, is_promo, temp, dayofweek
train_X, train_y = ml_df[features], ml_df['y']

# 3) Train XGBoost on residuals (y - prophet_yhat)
residual = train_y - prophet_yhat_aligned
xgb_model.fit(train_X, residual)
resid_pred = xgb_model.predict(test_X)

# 4) Final forecast = prophet_yhat + resid_pred

(यह pseudo-code production pipelines के लिए simplified है — scale पर data batching, model versioning और monitoring चाहिए।)

Metrics (MAPE, RMSE, Bias)

Evaluate models using MAPE for business interpretability, RMSE for scale sensitivity, और track bias (over-forecast / under-forecast) separately per SKU group.

🔍 Predictive Analytics और Real-Time Shelf Management

Forecasting सिर्फ future demand बताना नहीं है — इसका असली फायदा तब होता है जब forecasts को real-time operations (shelf replenishment, dynamic pricing, promotions) के साथ जोड़ा जाए। नीचे practical workflows और business impacts दिए गए हैं।

📈 Predictive Analytics — Demand, Promo Impact & Personalization

  • Promo Uplift Modeling: promotions की वजह से हर SKU पर expected uplift estimate करें — इससे μόνο उन्हीं items पर aggressive stocking करें जिनका ROI अच्छा दिखे।
  • Customer Segmentation: regional demand patterns समझ कर personalized offers भेजें — localized assortments बनाएं।
  • Markdown & Clearance Decisions: forecasted slow-moving items के लिए timely markdown triggers set करें ताकि waste कम हो।

Business impact: stock-outs घटाना, inventory carrying cost घटाना, और sales capture बढ़ाना।

⚡ Real-Time Shelf Management — IoT, POS & Alerts

  • IoT Shelf Sensors & Cameras: shelf availability detect कर के automatic replenishment alerts भेजें।
  • POS Stream Processing: streaming sales data से sudden demand spikes detect कर के micro-replenish triggers generate करें।
  • Store Ops Dashboards: real-time KPIs (shelf availability, sell-through rate, time to replenish) dashboards पर दिखें और alerts भेजें।

Operational benefit: faster response time, better in-store experience और reduced lost sales.

Example Workflow: Forecast → Alert → Replenish

  1. Nightly batch: store-level sales aggregated, models run to generate next-day demand per SKU.
  2. Threshold check: if forecasted demand > current on-hand + inbound, create replenishment order or transfer request.
  3. Realtime monitor: POS stream detects unexpected spike → triggers expedited transfer & SMS to floor staff.
  4. Close loop: post-event feedback fed back to model for retraining (reduce future bias).

Key Metrics to Track

Fill Rate (Shelf Availability), Service Level %, Stock-out Frequency, Sell-through Rate, Inventory Turnover, Forecast Bias (under/over).

Tools & Integrations (Examples)

Stream processing: Kafka/Fluentd → Real-time analytics: Spark Streaming / Flink → Monitoring: Grafana / Prometheus → Replenishment automation via ERP/Vendor APIs.

🔗 Supply Chain Visibility & CPFR — Bullwhip Effect से कैसे बचें

Accurate forecasting तभी प्रभावी होता है जब supply chain में visibility और collaboration हो। Walmart जैसे रिटेलers ने suppliers और distribution networks के साथ मिलकर CPFR frameworks लागू किए हैं ताकि demand-signal distortions (Bullwhip Effect) कम किए जा सकें।

📚 CPFR क्या है? (Collaborative Planning, Forecasting & Replenishment)

CPFR एक business practice है जिसमें retailer, distributor और supplier मिलकर shared forecasts, inventory plans और replenishment schedules बनाते हैं। इससे information delays घटते हैं और supply chain के हर हिस्से में alignment बढ़ता है।

(Keywords targeted: CPFR, Bullwhip Effect, supply chain visibility)

🛠️ Practical Steps to Improve Visibility

  • POS → Shared Dashboards: stores से real-time POS data suppliers के साथ share करें ताकि demand signal तुरंत दिखे।
  • Vendor Collaboration: vendor portals में forecast uploads और joint review cycles रखें (weekly/monthly cadence)।
  • Lead Time Reduction: suppliers के lead-time SLAs define करें और safety stock rules dynamic रखें (based on service level targets)।
  • Inventory Transfers: internal transfer policies रखें ताकि regional spikes के समय stock quickly relocate किया जा सके।
  • Automated Exception Flows: forecast vs actual divergence पर automated alerts और human review workflows बनाएं।

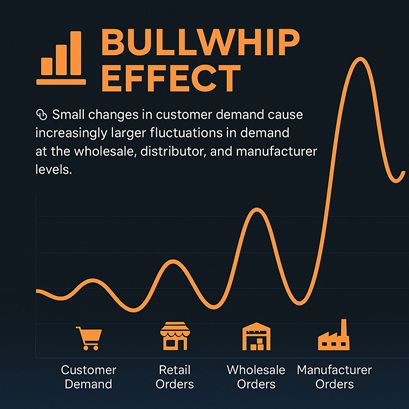
📉 Bullwhip Effect — छोटा सा उदाहरण

जब retailer छोटे demand changes को over-react करता है (ज्यादा order place कर देता है), तो supply chain में ऊपर की तरफ fluctuations amplify हो जाते हैं — इसे Bullwhip Effect कहते हैं। CPFR और shared visibility से इसे घटाया जा सकता है।

Bullwhip Effect Diagram: Customer → Retailer → Wholesaler → Manufacturer orders amplifying

🔎 Metrics for Supply Chain Health

Order Fill Rate, Forecast Accuracy (MAPE), Supplier On-Time %, Lead Time Variance, Inventory Days of Supply (DOS), Transfer Frequency.

✅ CPFR Implementation Checklist

  1. Data sharing agreement और access controls तैयार करें।
  2. Common forecast format (SKU-store-date granularity) define करें।
  3. Joint forecast review meetings calendar set करें (weekly/monthly).
  4. Exception thresholds और escalation workflows design करें।
  5. Continuous improvement loop: post-mortem और forecast bias analysis रखें।

⚠️ Challenges & Limitations — और India में Practical Applicability

AI-driven forecasting powerful है पर real-world deployment में कई चुनौतियाँ आती हैं — खासकर भारत जैसे diverse और fragmented retail market में। नीचे प्रमुख challenges और इनके practical समाधान दिए गए हैं।

📉 Data Quality & Bias

खराब या incomplete data से forecasts गलत हो सकते हैं — missing POS logs, mis-labelled SKUs, या seasonal outliers जैसी problems आम हैं।

Mitigation:

  • Data validation pipelines: missing checks, schema validation।
  • Outlier detection और domain-driven feature checks।
  • Diverse datasets और fairness audits to reduce bias।

💸 Cost & Infrastructure

GPUs, reliable cloud infra और low-latency networking costly हो सकते हैं — छोटे retailers के लिए barrier बनता है।

Mitigation:

  • Use managed cloud services (spot instances, serverless inference) और model distillation।
  • Edge-optimized models और schedule-based nightly batches small stores के लिए बेहतर।

👩‍💻 Skill Gap & Change Management

Data scientists, ML engineers और ops staff की कमी से projects stall हो सकते हैं। साथ ही store staff में tech adoption challenges होते हैं।

Mitigation:

  • Upskilling programs, vendor partnerships और managed ML vendors adopt करें।
  • Start with pilot stores, phased rollout और clear SOPs (standard operating procedures)।

🔐 Privacy, Compliance & Governance

ग्राहक डेटा का secure handling, anonymization और India की regulatory landscape ध्यान में रखना ज़रूरी है।

Mitigation:

  • Data minimization, hashing/anonymization और role-based access controls लागू करें।
  • Data-sharing agreements और vendor audits रखें।

🇮🇳 India میں Applicability — Practical Tips for Indian Retailers

Localize Features

Include regional festivals, local weather patterns, and market days as features — India में regional variation बहुत ज़्यादा है।

Low-cost Pilots

Start with a few pilot stores using nightly batch forecasts and manual SOPs before full automation।

Vendor Partnerships

Local tech vendors और managed analytics providers के साथ partnership करके infra और skill gaps भरें।

Affordable Tools

Open-source tools (Prophet, scikit-learn), lightweight model serving और cloud credits से cost कम रखें।

छोटा सलाह: pilot → measure → iterate — यही fastest और safest तरीका है India के varied retail landscape में AI adoption का।

✅ Quick Implementation Checklist

  1. Small pilot stores चुने और baseline metrics collect करें (fill rate, stock-outs).
  2. Minimum data pipeline: daily POS extract, basic cleaning और feature store ready रखें.
  3. Choose baseline models (Prophet / XGBoost) और simple ensembling adopt करें.
  4. Define SLAs, exception workflows और human-in-the-loop review steps.
  5. Measure regularly, analyze forecast bias और stepwise expansion करें।

❓ Retail FAQs — Walmart Inventory Forecasting

अक्सर पूछे जाने वाले practical सवाल — short answers ताकि readers तुरंत समझ सकें और search snippets में अच्छा दिखे।

Walmart जैसा forecasting system छोटे retailers के लिए realistic है?
हां, लेकिन phased approach चाहिए — nightly batch forecasts, pilot stores, और lightweight ML (Prophet/XGBoost) से शुरू करें। बड़े infra की जगह managed services और local vendors मदद कर सकते हैं।
Bullwhip Effect को तुरंत कैसे कम करें?
POS data sharing, shorter review cadences, dynamic safety stock और vendor SLAs लागू करें। CPFR meetings और automated exception alerts बहुत प्रभावी होते हैं।
Forecast accuracy measure करने के best metrics कौन से हैं?
Business-useful metrics: MAPE (interpretability), RMSE (scale-sensitive), और Forecast Bias (under/over by SKU-group). Service level और fill rate भी track करें।
कौन से features सबसे ज़्यादा matter करते हैं retail forecasting में?
Lag features, rolling means, promo flags, holiday indicators, price, local weather, और regional events/market days — ये सब high-impact features हैं।
AI models से inventory cost सच में घटेगा क्या?
हाँ — improved forecasts reduce stock-outs और overstock, जिससे carrying cost घटता है। पर ROI देखने के लिए pilot → measure → scale approach अपनाएँ।

निष्कर्ष — Walmart से क्या सीखें और आगे क्या करें?

Walmart का उदाहरण बताता है कि सही डेटा, advanced forecasting models और supply-chain collaboration मिलकर inventory efficiency को काफी बेहतर बना सकते हैं। छोटे retailers के लिए practical रास्ता: pilot → measure → iterate → scale। Start small, focus on high-impact SKUs और gradually build your forecasting capability.

Meta suggestion: Use title — Walmart Inventory Forecasting with AI: टाइम-सीरीज़ और Retail Analytics [2025] and meta-description — जानिए कैसे Walmart AI और time-series forecasting से inventory losses घटा रहा है — actionable steps और India applicability।

Vista Academy – 316/336, Park Rd, Laxman Chowk, Dehradun – 248001
📞 +91 94117 78145 | 📧 thevistaacademy@gmail.com | 💬 WhatsApp
💬 Chat on WhatsApp: Ask About Our Courses