
Table of Contents
ToggleData analysis transforms raw information into meaningful business insights. Whether you’re a data analyst or a decision-maker, understanding the data analysis process helps you solve real-world problems efficiently. In today’s era of predictive analytics and AI-driven insights, these seven steps serve as your foundation to extract, analyze, and act on data effectively.
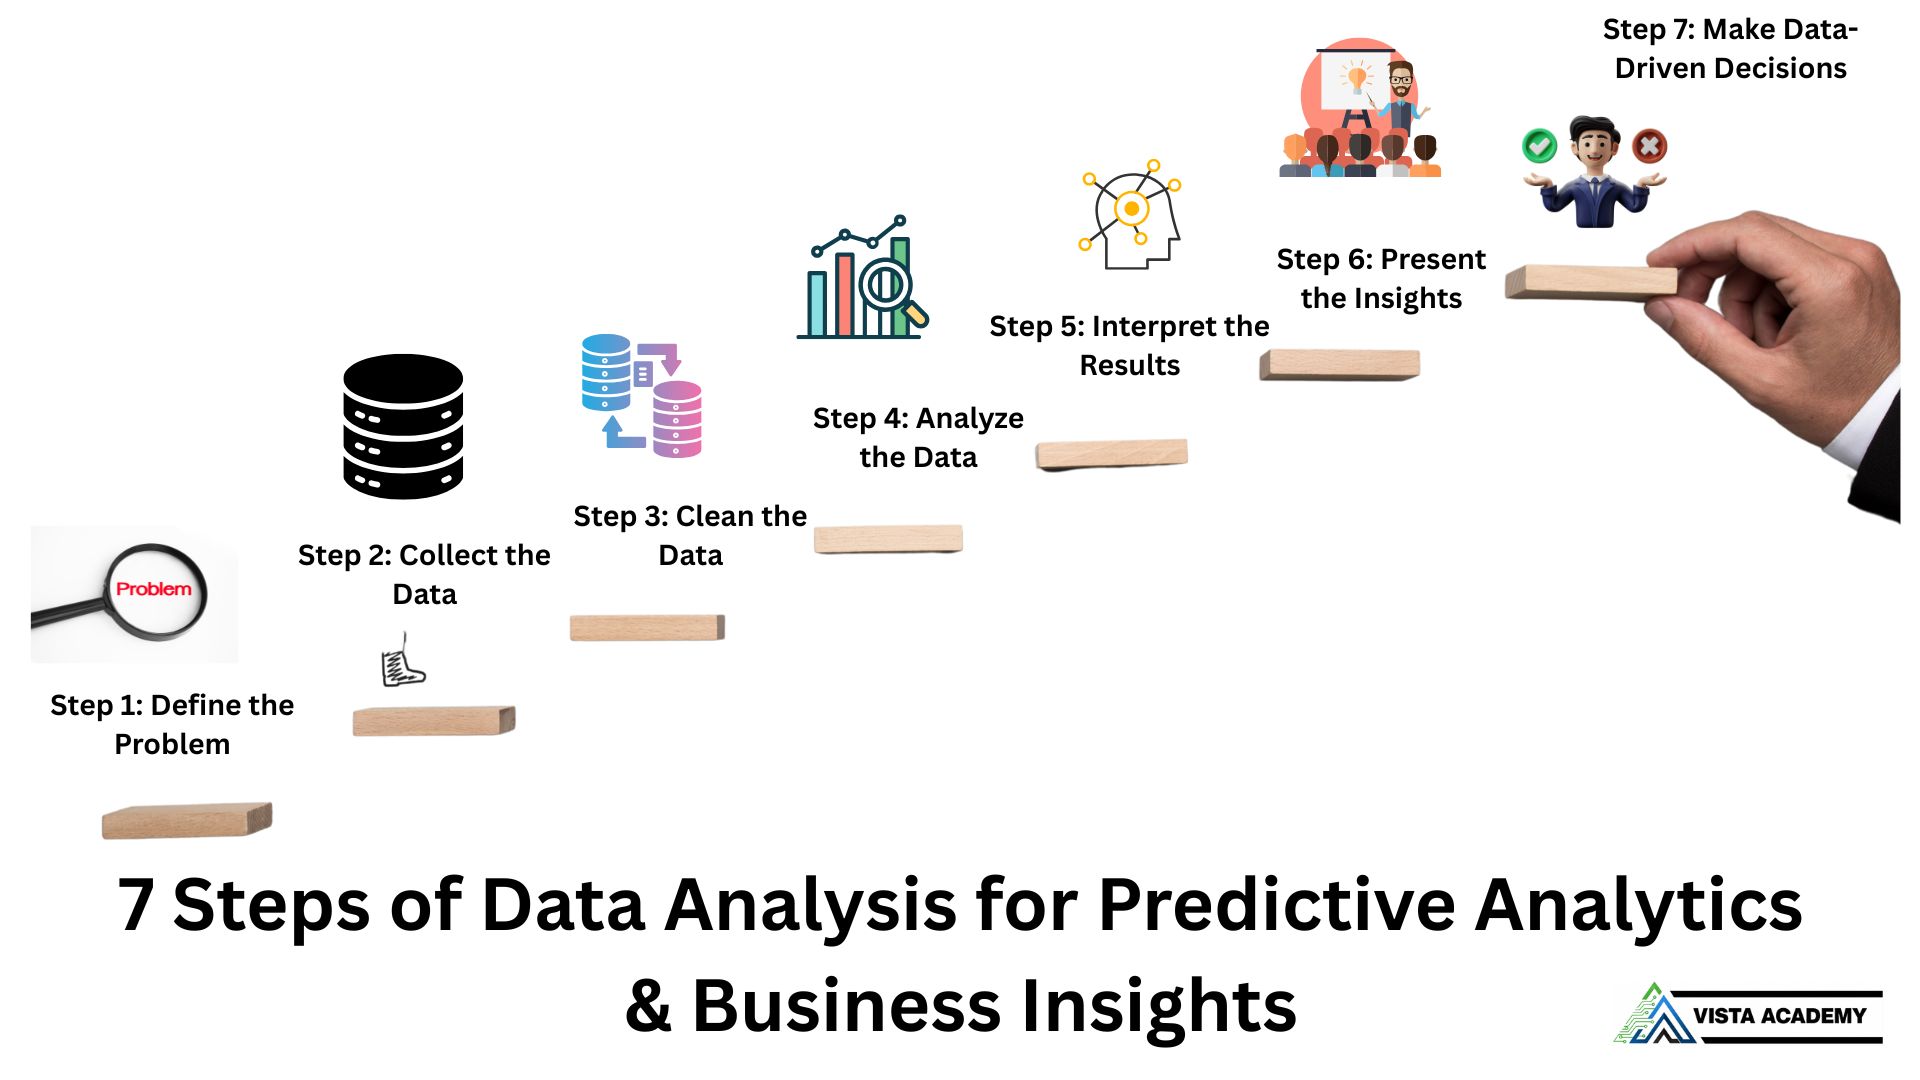
Start with clarity. Define what problem you’re solving and what goals the analysis should achieve. This helps focus your work and align it with business objectives.
Gather data from relevant sources — internal databases, surveys, APIs, or public datasets. Ensure your data is authentic, consistent, and comprehensive.
Remove duplicates, fix missing values, and correct errors. Clean data ensures your results are accurate and reliable.
Apply statistical techniques, machine learning, or visualization tools to find trends and relationships within the data. This step reveals hidden patterns.
Translate numbers into narratives. Understand what your analysis says about the problem and how it aligns with the business objectives.
Use data visualization tools to share your findings clearly. Graphs, dashboards, and infographics make your results easy to grasp for stakeholders.
Finally, use your insights to take meaningful action. Data-driven strategies lead to improved performance, reduced risks, and better business outcomes.
📘 Want to explore how predictive analytics transforms business strategies? Read our expert guide on Data Mining & Predictive Analytics Techniques for Business .
Quick answer: The data analysis process is a structured way to turn raw data into decisions. It moves from defining the problem and collecting data to cleaning, analyzing, interpreting, and presenting results—then taking action and monitoring impact.
The first and most crucial step in the data analysis process is defining the business problem. This forms the foundation of your entire analysis — guiding how you collect, analyze, and interpret data. Without a well-defined problem, even the best analysis can miss the mark and fail to deliver actionable business insights.
A clearly defined problem gives direction to your entire project. It ensures that data collection is relevant, analysis is focused, and outcomes are aligned with real business needs. It also saves valuable time and prevents misaligned data work or wasted resources.
Collaborate with key stakeholders — managers, clients, or department heads — to understand goals, challenges, and expectations. Their input ensures your analysis aligns with organizational priorities.
Narrow down the problem. Avoid vague goals like “increase sales.” Instead, frame questions precisely, e.g., “What factors caused a 20% decline in sales last quarter?”
A measurable question allows for data-backed solutions. For example, instead of “How can we improve satisfaction?” ask “What factors led to a 10% dip in customer satisfaction this quarter?”
Every problem should connect with larger business objectives. If your goal is to improve retention, your problem might be: “Why are 15% of users unsubscribing within 30 days?”
“What factors contributed to a rise in customer churn over the last six months?” This helps you analyze customer behavior, satisfaction, and product performance.
“Which marketing campaigns have the highest conversion rates?” This question helps identify ROI, optimize ad spend, and refine marketing strategies.
Defining the business problem is not just the first step — it’s the most important one. When you ask the right question, every subsequent step of data analysis becomes more accurate, efficient, and impactful. It ensures your insights truly serve business goals and lead to meaningful, measurable results.
Once the business problem is clearly defined, the next step is to collect data from the most relevant sources. Effective data collection ensures your analysis is based on accurate, up-to-date, and meaningful information. The sources of data can be internal, public, or external, depending on your business needs.
Internal databases like CRM systems, ERP tools, and financial records contain valuable data within your organization. They help analyze internal operations, customer interactions, and performance metrics for more informed decision-making.
Publicly available datasets — such as government portals, open data repositories, or research databases — provide external context. These can help identify trends, patterns, and factors influencing your industry or market.
Data from third-party APIs, market research firms, or social media analytics tools gives broader insights into customer behavior, competitor performance, and emerging trends across industries.
Customer feedback through surveys, product reviews, or support tickets offers direct, qualitative insights into satisfaction levels, challenges, and user experience — key for improving products and services.
Always ensure that the data collected is relevant, reliable, and high-quality. Avoid gathering excessive or unrelated data, as it can lead to confusion, increased processing time, and diluted insights. Well-curated data leads to accurate analysis and meaningful business outcomes.
Raw data is rarely perfect. It may contain missing values, duplicates, errors, or inconsistencies that can distort your analysis. The process of data cleaning (or data preprocessing) ensures that your dataset is accurate, consistent, and reliable — forming the backbone of trustworthy analytics.
Duplicate records often appear when data is collected from multiple sources. Removing them ensures that each record in your dataset is unique, preventing overestimation or bias in analysis.
Missing data can mislead your model or analysis. You can fill them using mean, median, or predictive imputation — or remove incomplete rows if appropriate.
Data inconsistencies occur when values are formatted differently or mislabeled (e.g., “India” vs “IND”). Standardizing formats ensures uniformity across your dataset.
Not all collected data contributes to your analysis. Removing unnecessary variables or outliers helps streamline computation and improves accuracy.
After cleaning, it’s essential to validate your data for consistency and correctness. Cross-check your dataset against trusted sources or expected ranges to ensure reliability.
Data cleaning might seem tedious, but it is the most critical step before analysis. Clean, high-quality data ensures your insights are accurate and your decisions are data-driven. Remember — “Better data leads to better analytics.”
Once the data has been cleaned and structured, it’s time to explore and analyze it. This stage transforms raw information into meaningful insights using statistical methods, visualization tools, and advanced analytics techniques. Your choice of analysis depends on the problem type and the nature of the data available.
Descriptive analytics helps summarize data to understand what has happened. It uses measures like averages, totals, and percentages to present a snapshot of past performance and identify high-level trends.
Diagnostic analytics digs deeper into “why” something happened. Techniques such as correlation analysis, regression, and drill-down reports help identify causes and contributing factors behind trends.
Predictive analytics uses statistical modeling and machine learning to forecast future events. By analyzing historical data, it helps anticipate demand, sales, customer churn, or potential risks.
Prescriptive analytics goes beyond prediction — it recommends actions. Using optimization models, AI, or simulation techniques, it provides strategies to achieve the best outcomes based on your objectives.
Throughout the analysis, always link your findings back to the business questions defined earlier. Use data visualization tools — dashboards, heat maps, or charts — to make patterns and insights visually clear. Effective visualization bridges the gap between data and decision-making.
After completing your data analysis, the next vital step is to share your findings with stakeholders. Clear communication ensures your insights drive smart business actions. The best way to communicate data is through visual storytelling — turning numbers into narratives using charts, dashboards, and presentations.
Dashboards provide a real-time, interactive snapshot of your business metrics. They allow users to explore data visually and monitor key performance indicators (KPIs) at a glance. Platforms like Power BI, Tableau, or Google Data Studio are ideal for creating dynamic dashboards.
Reports combine written analysis with visual elements to present a comprehensive summary of findings. A well-structured report includes an executive summary, visualized data insights, and actionable recommendations — perfect for decision-makers who need a detailed view.
Presentations are ideal for communicating insights concisely to executives or teams. Use slides to emphasize key takeaways and integrate visuals like charts or infographics to support your points. This approach encourages interactive discussions and real-time feedback.
Tailor your communication to your audience. Avoid technical jargon when addressing non-technical stakeholders, and always provide context for your findings. Clear visualization and storytelling ensure your analysis inspires actionable, data-driven decisions.
After analyzing your data and extracting valuable insights, the final step is to deploy predictive or machine learning models that can forecast outcomes and automate business processes. These models empower organizations to make data-driven, real-time decisions based on continuous learning from historical data.
Predictive models use historical data to estimate future outcomes. Businesses rely on them for sales forecasting, demand prediction, and customer behavior analysis. By identifying trends early, predictive models help companies stay proactive rather than reactive.
Classification models group data into predefined categories such as customer segments, fraud vs. non-fraud, or spam vs. non-spam emails. These models enhance decision-making by enabling targeted strategies and risk detection.
Optimization models determine the most efficient solution for business challenges. Common applications include supply chain optimization, resource allocation, and logistics planning. These models help maximize profit, reduce waste, and enhance operational efficiency.
Once developed, models must be deployed into business systems — integrated with live data sources for real-time predictions and automated actions. Regular monitoring and retraining ensure models stay accurate as new data patterns emerge. This continuous improvement cycle forms the backbone of modern AI-powered analytics.
🚀 Want to learn how to build and deploy predictive models yourself? Explore our hands-on course — Data Analytics & Machine Learning Course in Dehradun — and start your journey toward becoming a professional Data Analyst or Data Scientist.
The final step in the data analysis process is continuous monitoring and validation of your models and insights. Data analysis is not a one-time activity — as new data arrives, business environments evolve, and trends shift, your models must adapt. Ongoing validation ensures your analytics remain accurate, relevant, and reliable over time.
Regularly evaluate model accuracy by comparing predictions with actual outcomes. Track performance metrics such as precision, recall, RMSE, or accuracy score. A sudden decline in results may signal model drift — a sign that it’s time to retrain or adjust your approach.
As new data is collected, recalibration ensures your models adapt to evolving patterns or market conditions. This process keeps predictions consistent and prevents outdated insights from influencing decision-making.
Always verify that model outcomes continue to align with your organization’s strategic goals. Validation ensures the analytics process remains purpose-driven — connecting every data point back to measurable business impact.
Effective monitoring and validation transform static models into dynamic decision systems. By consistently tracking performance, recalibrating models, and validating against objectives, businesses ensure long-term success through data-driven strategies and continuous improvement.
📘 Want to learn practical skills for model monitoring and performance tracking? Explore our advanced course: Data Mining & Predictive Analytics for Business — and gain hands-on experience in maintaining accurate, real-world data models.
The 7 steps of data analysis — from defining the problem to monitoring results — provide a structured approach for making data-driven business decisions. But remember, data analysis is not a one-time effort. It’s an ongoing, iterative process that evolves as your data, goals, and business environment change.
Each stage plays a crucial role in ensuring your insights are accurate and actionable. From collecting and cleaning data to deploying predictive models and validating outcomes, this framework empowers organizations to continuously improve and make smarter, evidence-based decisions.
As your organization grows, revisiting these steps regularly ensures your analytics stay aligned with evolving business goals. Over time, this approach enhances accuracy, optimizes performance, and turns raw data into a strategic advantage.
Whether you’re just starting your journey or refining your existing analytics process, following this proven methodology helps you transform data into actionable intelligence and measurable business impact.
🚀 Take the Next Step in Your Data Career with Vista Academy
Learn how to perform real-world data analysis, build predictive models, and turn insights into business results. Our Data Analytics & Machine Learning Course in Dehradun provides complete hands-on training from fundamentals to advanced tools.
Enroll Now →Join the Best Data Analytics Course in Dehradun at Vista Academy — where learning meets innovation. Our program covers everything from data analysis, data visualization, Python, Excel, Power BI, and Machine Learning to advanced AI applications. Gain hands-on experience through live projects and become job-ready for one of the most in-demand careers in 2025.
📍 Address: 316/336, Park Road, Laxman Chowk, Dehradun, Uttarakhand 248001
📞 Phone: 094117 78145
🌐 Learn more at www.thevistaacademy.com
A Structured Approach to Transform Raw Data into Actionable, Data-Driven Decisions.
Conclusion: Data Analysis is an **Ongoing and Iterative Process**—continuous validation ensures long-term accuracy and impact.
Deepen your knowledge of Data Analytics and Data Science with these handpicked articles from Vista Academy.