11Oct, 2022
How Airbnb Improves Product and Marketing with Data Science
[web_stories_embed url=”https://www.thevistaacademy.com/web-stories/how-airbnb-improves-product-and-marketing-with-data-science/” title=”How Airbnb Improves Product and Marketing with Data Science” poster=”https://www.thevistaacademy.com/wp-content/uploads/2022/10/cropped-People-say_img.jpeg” width=”360″ height=”600″ align=”none”]

10Oct, 2022

8 Strategies for Pharmaceutical Companies to Use Analytics for Success
[web_stories_embed url="https://www.thevistaacademy.com/web-stories/8-strategies-for-pharmaceutical-companies-to-use-analytics-for-success/" title="what are Uses of Big Data Analytics In Marketing" poster="https://www.thevistaacademy.com/wp-content/uploads/2022/10/cropped-People-say_img.jpeg" width="360" height="600" align="none"]

Pharma data analytics and its supporting infrastructures- advancements in cloud computing, machine learning, etc. promise several cutting-edge innovations to deliver insights into pharma to formulate a fact-based strategy in the global market using big data analytics for pharma industry.
Pharma data analytics offers several benefits to the pharmaceutical firms such as the ability to perform in-depth competitor analysis and monitoring and to improve the in-house processes with data-backed insights.
Pharma businesses are fighting for victory in today’s dynamic and rapidly shifting competitive arena by improving their performance without raising their overall operating costs. The pharmaceutical sector is seeing a growth in cutting-edge technology like artificial intelligence, robotic process automation, and big data analytics, which puts pressure on pharma companies to develop quickly in order to acquire a competitive edge and take advantage of market opportunities.
Drug development and production typically involve protracted clinical trials and high expenditures. But lately, the sector has been rapidly expanding.
Boost Drug Development And Discovery
With the patents on blockbuster pharmaceuticals expiring, the pharmaceutical industry is attempting to speed up the process of getting a drug to market as the cost to launch a new drug into the market is increasing.
Pharmaceutical analytics can aid businesses in making more informed decisions to speed up the data discovery process by sifting through enormous datasets of scientific publications, academic research papers, and control group data. Pharmaceutical analytics also uses predictive algorithms to analyse these enormous swathes of data. Improvements in financial performance will be facilitated by innovation in drug research.
Boost the effectiveness of clinical trials
By identifying and analysing various data points, such as the participants’ demographic and historical data, remote patient monitoring data, and by looking at past clinical trial events data, big data analytics in pharma can assist pharmaceutical businesses in decreasing the cost and speeding up clinical trials.
Pharma companies can employ pharmaceutical analytics to speed up disease diagnosis, find test sites with high patient availability, and create more effective control groups and clinical trials by streamlining this entire process.
Create and Customize Targeted Medications
Because each person has a distinct genomic make-up, individualised medication is ideal. However, it is difficult to process complicated data utilising current biology and technology to arrive at wise conclusions.
By combining data from genomic sequencing, patient medical sensor data (the device that can be worn to detect physical changes in an individual during treatment), and electronic medical records, big data analytics in the pharmaceutical business can find a solution to this issue.
Pharma companies can find trends in unstructured genomic data and use big data technologies to analyse them to make more individualised and effective medications for their patients.
Reduce costs while boosting drug use
It becomes increasingly important to boost overall process efficiency as pressure on pharmacy operating margins increases. Pharmaceutical businesses can use pharmaceutical analytics to make better decisions to boost revenue and cut costs by performing granular analysis of key metrics like average ingredient cost per prescription, rebate as a percentage of total drug spending, and drug utilisation review savings per member per year.
Drive efficient marketing and sales operations
Pharma business intelligence can assist identify new markets and measure the effectiveness of various marketing channels in order to prioritise efforts and obtain a competitive advantage. Making better and quicker judgments will be made possible by having a better understanding of sales rep performance.
You may use this to make smart judgments about how to allocate your resources and capital. Pharmaceutical companies are seeing a rise in the efficiency of their sales & marketing tactics as a result of researching patient trends to find new markets, implementing cutting-edge technology, and big data analytics.
Improve Compliance
Due to the increasingly strict government requirements, breaking the law can result in civil and criminal lawsuits, which can damage the drug manufacturer’s reputation and need significant financial outlays to resolve the allegations.
Big data analytics in pharma can assist swiftly unearth insights to expedite governance choices and reveal the gaps in the safety of current pharmaceuticals due to the complex and dynamic environment in which drugmakers operate in numerous locations and complex legal contexts.
Human employees can benefit from digital operations support on the floor to help them manage their everyday responsibilities and raise alerts as needed to lower the risk of compliance failures.
Increasing productivity and employee training
By using pharmaceutical analytics and data insights to enhance their current operations and processes, pharmaceutical businesses can considerably cut their expenses. Pharmaceutical companies can comprehend how machine settings, operator skill levels, or raw material inputs will impact the output quality by applying advanced analytics.
It will help pharmaceutical companies make judgments that will optimise and enhance the entire process. Pharma organisations can anticipate risks like quality problems, equipment failures, or significant changes in demand by using predictive analytics and big data analytics in the industry.
BOOST YOUR CAREER WITH VISTA SOLUTIONS

5Oct, 2022
How Data Science Applications in the Retail Industry
[web_stories_embed url="https://www.thevistaacademy.com/web-stories/applications-of-data-science-in-the-retail-sector/" title="Applications of Data Science in the Retail Sector" poster="https://www.thevistaacademy.com/wp-content/uploads/2022/10/cropped-call-back_img.jpeg" width="360" height="600" align="none"]
Data science uses scientific methods, processes, algorithms, and systems to extract knowledge from data, and use the maximum advantage of this data to make major decisions is a key strategic practice for any business.
The advent of the new digital era has made data today’s industry a powerful force for growth. Large corporations are beginning to spend money on data for a more dependable form.
Furthermore, data is now crucial for anyone wishing to make business decisions that will be profitable. Every company’s decision-maker requires data to be very helpful; a careful examination of a large amount of data enables influencing or, more accurately, manipulating the decisions of the customers.
When it comes to business, retail is a sector that is growing quickly every day. If you don’t know anything about retail, read on.
Retail in Data Science
Retail is a subcategory of business in which a transaction happens when a company sells a good or service to a single customer for that person’s own use. The fact that the end-user is the buyer distinguishes the sale as a retail transaction. When we discuss the actual transaction, it may take place via a variety of sales communication channels, including direct, online, etc.
The relationship between consumers and retailers is evolving quickly. The retailer analyses data and creates a scenario for the consumer. As a result, a customer is susceptible to being duped by the strategies created by businesses. Wallmart, Target, and other stores are excellent instances of retail.
You are aware that the need for data is enormous and that the retail sector produces a lot of customer data. Data science enables analysis of this data to reveal trends in customer and market fusion.
Data Science Applications in the Retail Sector
Price Optimization
What would be important to you while buying, if you were a customer? Price, quality, and a host of other factors are important, but what if you could get greater quality for less money? You would undoubtedly be thrilled. Therefore, everything is dependent on pricing; in fact, 70% of all consumers say that price is the primary factor in making a purchase. Yes, that applies to the retailer as well. According to the producer pricing theory, the price of a good depends not only on the quantity of resources used in its manufacture but also on the kind of consumer who will buy it. The data analysis technologies raise the issue’s potential impact to a new level.
If you are aware that data science offers a wide range of optimization techniques that aid retailers in discovering their customers’ covert strategies. Among them are:
- segmenting customers
- mysterious shopping
- Price flexibility, competitor pricing, etc.
Price Optimization
The most effective way to draw customers is through marketing strategy, which also benefits retailers. When discussing its procedure, it first gathers client transaction data. This technique allows for the broad-scale prediction of future decisions and choices. When they construct marketing scenarios, knowledge about the goods’ likes, dislikes, and previews is more useful.
Steps required: 1. After gathering the data, we will conduct some exploratory data analysis to determine the best model to uncover the information we seek.
2. Next, we will choose the model that best fits our data and will produce the greatest results in terms of accuracy.
3. The data is formatted in a usable fashion after the model is selected. This can entail determining how to handle missing values, duplicates, or other factors that complicate the model’s application.
4. The model must then be adjusted. This indicates that the model is operating as intended and has not been overfit to the data.
Retail fraud detection
We are aware that obtaining customers’ trust is the most crucial element influencing the development of industries. What if there was customer fraud going on? Then, as a result of these actions, industries damaged customer trust and suffered significant losses.
The reputation of the business is protected through data science in retail. For retailers, detecting fraud is a difficult issue. Following some financial setbacks, businesses are increasingly turning to machine learning and neural network concepts in new digital technology. This makes it possible for them to constantly monitor all actions and stop any fraudulent ones.
Numerous outlier detection techniques are also used to isolate frauds. Tools for outlier detection each have a unique approach to the issue, such as time series analysis, cluster analysis, real-time transaction monitoring, etc.
And when we discuss the methods of machine learning for resolving this issue:
- Techniques
ML algorithms under supervision: time series analysis, logistic regression, and neural networks - Cluster analysis, Bayesian networks, peer group analysis, breakpoint analysis, and Benford’s law are unsupervised machine learning algorithms (law of anomalous numbers)
- Quantiles, the probability distribution, association rules, and the average are statistical tools.
- Real-world Example: Credit card frauds have always occurred, but their prevalence is only recently increasing due to the rising number of daily online transactions involving credit cards. Day by day, frauds are rising, and many of these frauds are happening during online purchases.
Implementing Augmented Reality
In the context of data visualisations, augmented reality (AR) can become a little more complicated and dynamic. While the camera displays the image of a certain domain, the domain itself is marked with specific points (either in a Marker or Markerless mode), allowing the AR system to identify the Specific Point and then become aware of what that Specific Point is when it comes into view of the camera.
Many retail businesses have utilised the phrase “Try before you buy” in their marketing when you hear it in any commercial setting. Customers can explore a product in real time via augmented reality (AR). Rapidly, AR has emerged as a crucial tool for
Merchandising
Merchandising refers to the activity that aids you in promoting the product when a customer comes to buy the item. For example, if you are a shopkeeper, you will market your product to the consumer for purchase in order to gain money. The retail industry now relies heavily on merchandise.
It employs a method in which machine learning algorithms are used to influence client decisions after they have made a purchase in order to persuade them to buy more products. The three pillars of retail are selection, experience, and value, or the things you need to sell, how you would offer them, and the price you would charge.
Many strategies will be employed to influence the customers’ choices. among them are:
Organizing the merchandise on the shelves
attractive pricing, attractive pricing, gift-giving product presentation, and beautiful packaging
Location of New Store
What if you knew where your new industry should be located? Wright, that’s wonderful for you. Data science aids merchants in locating the ideal sites for the construction of new stores to sell their goods. It uses the customer’s judgments on the area, and a lot of data is needed for this study. For instance, internet customer data, local market trends, the locations of other neighbouring stores, etc.
This research seeks to offer a solution for this issue and identify the ideal area for the new store to open by utilising data science, geospatial analysis, and machine learning approaches.
the shop’s primary concerns that need to be resolved:
• Must be near major metro stations • Must be near Apple stores • Must be far from other grocery stores • Must be in areas with high household income • Must be in areas with increasing economic growth • Ideally, in areas with both millennials and seniors
Inventory Management
As the name implies, this involves managing the important things for the future. Retailers strive to satisfy client needs at any time, in the appropriate location, in good shape, etc. The key to generating business insights that can assist you in making data-driven decisions for enhanced efficiency and profitability is currently held by today’s inventory control systems.
Even for large shops with enormous datasets, an inventory system may give you unmatched insights into consumer behaviour, product performance, and channel performance.
1. Availability of stock.
2. Demand for goods.
3. Product exchanges
What are the Types of Retail Data Analytics?
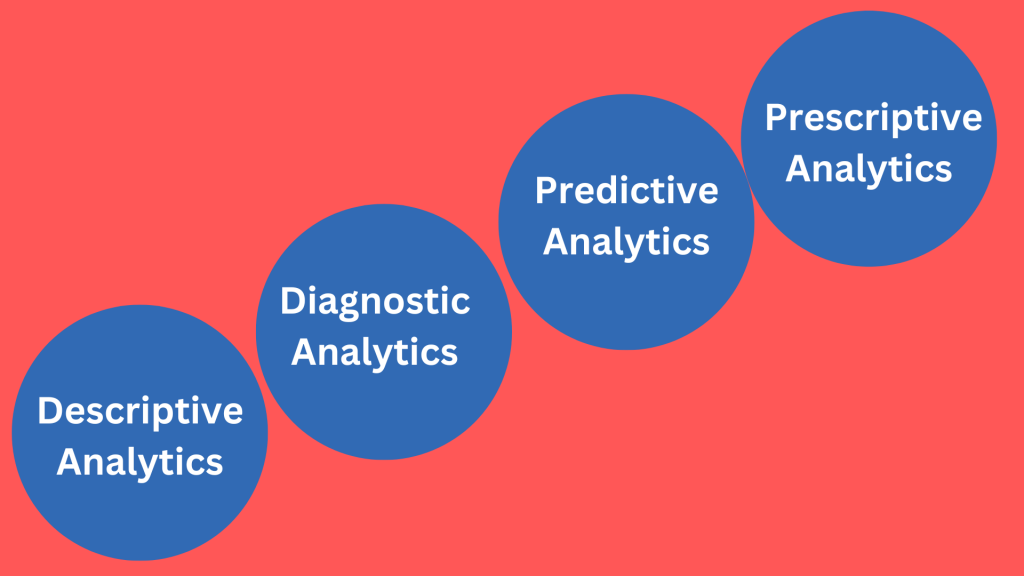
There are four different kinds of retail data analytics, and each one is crucial in giving modern merchants critical knowledge on how to run their companies. The four types are as follows:
- Descriptive Analytics
- Diagnostic Analytics
- Predictive Analytics
- Prescriptive Analytics
Descriptive Analytics
Descriptive analytics, the most popular sort of data analysis, assists merchants in structuring their data such that it tells a story.
It functions by integrating unprocessed data from numerous sources (POS terminals, inventory systems, OMS, ERPs, etc.) to produce insightful analyses of past and present performance.
Analysts used to perform these tasks manually in Excel, collecting data from various sources, preparing it, graphing it, etc. With today’s BI technologies and integrations, a large portion of this data collection and reporting effort may be automated.
Diagnostic Analytics
Diagnostic analytics, the most basic type of “advanced” analytics, aids merchants in using data to address the “why” of particular business issues.
Diagnostic analytics employs statistical analysis, algorithms, and occasionally machine learning to go deeper into the data and discover correlations between data points using the same raw data as descriptive analytics.
Additionally, anomalies can be identified and possible issues can be flagged using diagnostic analytics (if results do not match pre-programmed benchmarks and business rules).
Predictive Analytics
Predictive analytics informs you “what’s next” if descriptive analytics reveals the “what” of what is occurring in your company and diagnostic analytics reveals the “why.”
This kind of analytics is the second most sophisticated.
Effective predictive analytics forecasts the future using information from both descriptive and diagnostic analytics. This is due to the fact that knowing what has already happened and what caused it is necessary in order to effectively forecast what will happen next.
Prescriptive Analytics
Prescriptive analytics is the final frontier of analytics, and also the most advanced type.
The previous types of analytics can tell retailers “what” is happening, “why” it happened, and “what will happen next.” Prescriptive analytics can tell retailers “what you should do next” to get the best results.
To make good recommendations, a prescriptive analytics system needs to not only know what is likely to happen in the future but also needs to know what actions will lead to the best possible future outcome.
This is a difficult proposition because there are a nearly infinite number of actions a business can take to generate some change in the numbers.
There are multiple approaches:
Running simulations on a finite number of different initial conditions (different assortment, allocation, pricing, etc.) and choosing the conditions that lead to the highest profit
Using algorithmic AI, purpose-built for retail to make recommendations that lead to the best possible mathematical outcome (profit, GMROI, etc.)
Teaching a machine learning program to identify patterns and clusters of actions that lead to the best outcomes
Of course, the specific way different analytics companies achieve this is a closely guarded secret. But fundamentally, the process needs to generate recommendations that retailers can confidently follow 99% of the time.
Unlocking the Potential of Data Science in Retail
Data science plays a crucial role in the retail industry by analyzing vast amounts of data to gain insights into customer behavior, preferences, and trends. This helps retailers make informed decisions about inventory management, pricing strategies, marketing campaigns, and more.
Data science enables retailers to create personalized shopping experiences by analyzing customer data to understand individual preferences, purchase history, and browsing patterns. This allows retailers to offer targeted product recommendations and tailored promotions, increasing customer engagement and loyalty.
Data analytics helps retailers optimize inventory management by predicting demand patterns, identifying slow-moving items, and preventing overstock or stockouts. This ensures that the right products are available at the right time, reducing costs and improving customer satisfaction.
Predictive analytics uses historical and real-time data to forecast consumer behavior and market trends. Retailers can leverage this information to set optimal pricing strategies that maximize revenue, considering factors such as competitor pricing, customer willingness to pay, and demand fluctuations.
Sentiment analysis helps retailers understand customer opinions and emotions expressed in online reviews, social media posts, and other platforms. By analyzing sentiment, retailers can gauge customer satisfaction, identify product improvement opportunities, and address negative feedback promptly.
Data science optimizes the supply chain by analyzing data related to supplier performance, transportation logistics, and demand forecasting. This leads to improved efficiency, reduced costs, and faster response times, ultimately benefiting both retailers and consumers.
Recommendation systems use algorithms and data analysis to suggest products to customers based on their past purchases, browsing history, and similar users’ preferences. These systems enhance cross-selling and upselling opportunities, increasing average order value and customer satisfaction.
Data science aids in fraud detection by analyzing transaction data to identify unusual patterns or anomalies that could indicate fraudulent activities. By using machine learning algorithms, retailers can flag suspicious transactions for further investigation, protecting their financial interests.
Data-driven marketing uses insights from customer data to create targeted and relevant marketing campaigns. By understanding customer preferences and behavior, retailers can deliver personalized promotions and advertisements, leading to higher engagement and conversion rates.
In the future, data science in retail is likely to further advance in areas like real-time analytics, AI-powered chatbots for customer support, integrating offline and online shopping data, and using augmented reality for enhanced in-store experiences. Additionally, sustainability and ethical considerations might drive data-driven initiatives focused on eco-friendly practices and transparent supply chains.
26Sep, 2022
The 4 Types of Data Analysis and their difference
Businesses and organisations that continuously learn and adapt are the most successful. No matter what sector you work in, it’s critical to be aware of the recent past, the current state of affairs, and potential future developments. So how do businesses accomplish that?
Data analytics holds the solution. Most businesses constantly gather data, yet this data is meaningless in its unprocessed state. What you do with the data is what really matters. Data analytics is the act of examining raw data to identify patterns, trends, and insights that might provide valuable information about a certain business domain. Following that, informed judgments based on data are made using these insights.
AI and sophisticated analytics have gained popularity in recent years. There are a lot of blogs out there that discuss the benefits of employing sophisticated analytics in your company.
It is tempting to go right in and try to get advanced analytics straight immediately given the amount of value that they may provide. But these insights cannot be attained without the right foundations. What is the first step to obtaining these insightful data, then?
Advanced analytics success and the use of AI can be ensured by comprehending the analytics development and getting started in the proper spot.
56 percent of respondents claimed data analytics resulted in “faster, more effective decision-making” at their firms, according to MicroStrategy’s The Global State of Enterprise Analytics survey (pdf). Other advantages mentioned include:
- increased productivity and efficiency (64 percent)
- better financial results (51 percent)
- Finding and generating new sources of revenue for products and services (46 percent)
- enhanced client acquisition and retention (46 percent)
- enhanced client experiences (44 percent)
- advantage over rivals (43 percent)
WHO IS IN NEED OF DATA ANALYSIS?
Any business professional who takes judgments must have a solid understanding of data analytics. Data access is easier to come by than ever. You may overlook significant possibilities or warning signs if you design strategies and make decisions without taking the facts into account.
Skills in data analytics can be useful for the following professions:
Skills in data analytics can be useful for the following professions:
Marketers develop marketing plans by using information about customers, market trends, and the results of previous campaigns.
Product managers improve their companies’ goods by analysing market, industry, and user data.
Finance experts predict the financial trajectories of their organisations using historical performance data and market trends.
Human resources and diversity, equality, and inclusion specialists can use information on industry trends and employee perspectives, motivations, and behaviours to make significant organisational changes.
1. Descriptive Analytics
The foundation for all other types of analytics is descriptive analytics, which is the most basic type. It enables you to quickly summarise what occurred or is happening by drawing trends from the raw data.
What happened is answered by descriptive analytics.
Consider the scenario where you are studying the statistics for your business and discover that sales of one of your goods, a video game console, are increasing at a seasonal rate. Here, descriptive analytics can inform you, “Sales of this video game system increase each year in early December, early November, and October.”
Charts, graphs, and maps may clearly and understandably display data patterns, as well as dips and spikes, making data visualization a good choice for expressing descriptive analysis.
Data Aggregation:
Definition: Data aggregation involves combining and summarizing individual data points to form a higher-level overview. This can be done based on specific criteria such as time periods, locations, or categories.
Example: Aggregating daily sales data into monthly or yearly totals to understand overall performance.
Summary Statistics:
Mean: The average of a set of values.
Median: The middle value in a dataset when it is ordered.
Mode: The most frequently occurring value.
Standard Deviation: A measure of the amount of variation or dispersion in a set of values.
Range: The difference between the maximum and minimum values in a dataset.
Percentiles: Divides the data into 100 equal parts, helping understand the relative standing of a particular value.
Purpose: These statistics provide insights into the central tendency, spread, and distribution of the data.
Data Visualization:
Graphs and Charts: Represent data visually to identify patterns, trends, and relationships.
Examples: Bar charts for categorical data, line graphs for trends over time, scatter plots for relationships between two variables, and heat maps for visualizing variations in a matrix.
Purpose: Enhances understanding and communication of complex data patterns.
Data Exploration (EDA):
Techniques: Histograms, box plots, and summary statistics to identify data characteristics.
Outliers and Missing Values: Identification and handling of unusual or missing data points.
Purpose: Gain initial insights, understand the structure, and identify potential issues in the dataset.
Data Profiling:
Data Types: Understanding the types of data (numerical, categorical, etc.).
Data Integrity: Assessing the accuracy and consistency of data.
Completeness: Identifying missing values or incomplete records.
Anomalies: Detecting irregularities or outliers.
Purpose: Assess the overall quality and reliability of the dataset.
Segmentation:
Definition: Dividing data into meaningful groups or segments based on specific attributes or characteristics.
Example: Segmenting customers based on demographics, buying behavior, or preferences.
Purpose: Identifying different patterns and behaviors within the dataset for targeted analysis or decision-making.
Time Series Analysis:
Definition: Analysis of data collected over time to understand patterns, seasonality, and trends.
Techniques: Moving averages, trend analysis, and forecasting.
Purpose: Uncover temporal patterns and make predictions based on historical data.
In summary, descriptive analytics involves various techniques to organize, summarize, and visually represent data, providing valuable insights into its characteristics and patterns. These techniques serve as a foundation for more advanced analytics and decision-making processes.
2. Diagnostic Analytics
The following logical question, “Why did this happen?” is answered by diagnostic analytics.
This sort of analysis goes a step further by comparing current trends or movements, finding relationships between variables, and, when possible, establishing causal linkages.
Using the previous example, you might look at the demographics of video game console users and discover that they range in age from eight to 18 years old. The average age of the patrons, however, is between 35 and 55. Data from customer surveys that have been analysed show that buying a video game console as a present for kids is one of the main reasons people do so. The increase in sales throughout the fall and early winter may be attributed to the gift-giving holidays.
Using diagnostic analytics to identify
Root Cause Analysis:
Definition: Root cause analysis involves identifying the fundamental factors or reasons that contributed to a specific event or outcome. It aims to go beyond surface-level observations to uncover the underlying causes.
Techniques: Correlation analysis, regression analysis, and dependency analysis help in understanding relationships between variables and identifying potential causes.
Process: Investigating patterns and trends in the data to determine the root causes, which may involve exploring historical data, conducting interviews, and using various analytical tools.
Comparative Analysis:
Definition: Comparative analysis involves comparing different datasets or segments to identify variations, differences, and similarities in performance. It helps in understanding the relative performance of different entities.
Techniques: Comparative analysis may involve metrics such as percentages, ratios, and indices to quantify and compare performance. Visualization techniques like bar charts and heat maps are often used for easy comparison.
Purpose: To identify patterns, anomalies, and trends by comparing different dimensions, such as regions, time periods, customer segments, or product lines.
Hypothesis Testing:
Definition: Hypothesis testing is a statistical method used to validate or reject potential explanations (hypotheses) for observed outcomes. It involves formulating hypotheses, collecting data, and performing statistical tests to assess the significance of relationships.
Process: Formulating a null hypothesis and an alternative hypothesis, collecting data, conducting statistical tests (e.g., t-tests, chi-square tests), and interpreting the results to make informed decisions about the hypotheses.
Purpose: To provide evidence for or against proposed explanations and make data-driven decisions.
Drill-Down Analysis:
Definition: Drill-down analysis involves examining data at a detailed, granular level by exploring specific dimensions or attributes. It allows for a deeper understanding of the data and helps uncover insights that may be hidden when looking at higher levels of aggregation.
Techniques: Pivot tables, detailed reports, and interactive dashboards are often used to facilitate drill-down analysis. Users can navigate through layers of data to explore specific details.
Purpose: To identify specific trends, outliers, or patterns that may not be evident at a higher level of aggregation.
Cohort Analysis:
Definition: Cohort analysis involves studying groups of individuals or entities that share common characteristics or experiences. It helps in understanding how different cohorts behave over time and how they may differ from one another.
Techniques: Time-based segmentation is a common technique in cohort analysis. The behavior of specific cohorts is tracked over time to observe changes and trends.
Purpose: To gain insights into customer behavior, product performance, or employee performance by analyzing groups that share similar characteristics or experiences.
Data Mining and Machine Learning:
Definition: Data mining and machine learning involve using advanced algorithms to discover patterns, correlations, and predictive relationships in large datasets.
Techniques: Clustering, classification, regression, and association rule mining are common techniques in data mining and machine learning. These algorithms can uncover hidden insights and automate the discovery process.
Purpose: To extract valuable knowledge from data, predict future outcomes, and uncover complex relationships that may not be apparent through traditional analysis.
In summary, diagnostic analytics involves a set of techniques that go beyond describing data to understand why certain events or outcomes occurred. These techniques help organizations uncover insights, identify causation, and make informed decisions based on a deeper understanding of the data.
3. Predictive Analytics
In order to predict future trends or events or to provide a response to the question “What might happen in the future,” predictive analytics is utilised.
You can accurately estimate what the future may hold for your firm by examining historical data along with current industry trends.
For instance, knowing that, over the previous ten years, sales of video game consoles have peaked in October, November, and the first few weeks of December each year gives you enough information to forecast that the same trend will continue in 2016. This is a logical prediction, supported by upward trends in the video game industry as a whole.
Making forecasts about the future might assist your company in developing plans based on probable outcomes.
Here are some key aspects of predictive analytics:
- Data Preparation: Preparing and cleansing the data to ensure its quality and suitability for analysis. This includes handling missing values, outliers, and transforming the data into a format suitable for modeling.
- Feature Selection and Engineering: Identifying the most relevant features or variables that are likely to have predictive power. This involves selecting informative variables and creating new derived features that may enhance the prediction models.
- Model Development: Building statistical or machine learning models based on the historical data. Common techniques used in predictive analytics include regression analysis, decision trees, random forests, support vector machines, neural networks, and ensemble methods.
- Training and Evaluation: Training the predictive models using a portion of the historical data and evaluating their performance on another portion of the data. This is done to assess how well the models generalize to unseen data and to select the best-performing model.
- Prediction and Forecasting: Applying the trained models to new or future data to generate predictions or forecasts. These predictions can be in the form of numerical values, classifications, or probabilities.
- Model Validation: Validating the predictive models by comparing the predicted outcomes with the actual outcomes observed in real-world scenarios. This helps assess the accuracy and reliability of the models.
4. Prescriptive Analytics
Prescriptive analytics finally provides a response to the query, “What should we do next?”
Prescriptive analytics recommends actionable takeaways after considering all potential aspects in a circumstance. Making decisions based on data can be extremely helpful when using this kind of analytics.
To complete the video game illustration: What should your team decide to do in light of the anticipated seasonality trend brought on by the holiday gift-giving season? Perhaps you decide to do an A/B test with two adverts, one geared toward customers and the other towards the product’s end-users (children) (their parents). The results of that experiment can help determine how best to further capitalise on the seasonal rise and its purported cause. Or, perhaps you decide to step up your marketing initiatives in September with messages centred around the holidays to try to prolong the boost.
Here are some key aspects of prescriptive analytics:
- Optimization Modeling: Developing mathematical or computational models that represent the problem domain and capture the relationships between variables, constraints, and objectives. These models aim to find the best solution that maximizes performance or minimizes costs based on predefined criteria.
- Constraint Analysis: Identifying and incorporating constraints and limitations into the optimization models. These constraints could be related to resource availability, capacity limits, regulatory requirements, or business rules that need to be adhered to.
- Scenario Analysis: Conducting “what-if” analysis by simulating different scenarios and evaluating their potential outcomes. This helps assess the impact of different decisions or actions on the desired outcomes and facilitates decision-making under various conditions.
- Decision Support Systems: Developing decision support tools or systems that can assist decision-makers in evaluating alternative courses of action and selecting the optimal solution. These systems often provide interactive interfaces and visualizations to aid in the decision-making process.
- Recommendation Engines: Implementing recommendation systems that utilize advanced algorithms to suggest the best actions or options based on user preferences, historical data, and real-time information. These engines are commonly used in personalized marketing, content recommendation, and product recommendation.
- Continuous Learning and Adaptation: Prescriptive analytics systems can be designed to continuously learn from new data, feedback, and outcomes. This allows for the refinement and adaptation of models and recommendations over time, leading to improved decision-making and performance optimization.

24Sep, 2022
Top prime reasons for learning SQL for data analysis
What is SQL?
The standard language for working with Relational Databases is called Structured Query Language (SQL), which is pronounced either “S-Q-L” or occasionally “See-Quel.” The use of SQL to insert, search, update, delete, and alter database records is effective. It doesn’t imply that SQL can’t perform tasks beyond those. In actuality, it is capable of a great deal more. That was a quick summary of SQL. You can read my article on SQL Tutorial if you want to learn more about SQL and its commands.
Knowing what SQL is helpful if you’re looking for the best motivations to devote time to learning SQL.
The most sought-after expertise for software developer jobs is SQL, and including SQL in your resume significantly increases your chance of receiving calls and job offers. In conclusion, learn SQL if you are unsure or if you have any doubts; you won’t regret it.
The database is an important part of modern development. Working with a database is not easy and becomes tougher if the technology or language being used is complicated. If you have any experience in backend development, you may encounter the term “SQL”. SQL stands for Structural Query language. It is used to manage relational databases.
High Paying Jobs
The job market appears promising for SQL enthusiasts, from startups to well-established businesses, and it is anticipated to increase significantly over the next few years. All geographical areas offer excellent chances for SQL programmers and developers. Take a look at the graph below to see the UK wage trend for SQL Developers.
Ease of Learning and Use
Declarative Language:
SQL is a declarative language, which means that you declare what you wish to get or manipulate from the database rather than how. This abstraction simplifies the process and allows you to concentrate on the desired output, making it easier for beginners to understand.
English-like Syntax:
SQL has a syntax that is similar to English language constructs, including commands like SELECT, FROM, WHERE, GROUP BY, ORDER BY, and so on. This natural language style makes it friendly to people who do not have significant programming skills.
Interactive Environment:
SQL is typically used in an interactive environment, where you can immediately see the results of your queries. This real-time feedback facilitates rapid learning and experimentation.
Small Set of Commands:
SQL has a relatively small set of commands to perform most data retrieval and manipulation tasks. Learning a handful of essential commands is often sufficient to start working with databases effectively.
Abstraction from Database Complexity:
SQL abstracts the underlying complexities of database management systems, allowing users to interact with data without worrying about the underlying database structure or implementation details.
Rich Online Resources:
Due to SQL’s widespread use, there is a wealth of learning resources available online, including tutorials, documentation, forums, and online courses. This abundance of resources makes it easier for individuals to self-learn SQL.
Code Reusability:
Once you learn SQL, the knowledge can be applied to various database management systems, as most follow the SQL standard with minor variations. This reusability saves time and effort when switching between different database platforms.
Instant Gratification:
As you write SQL queries, you get immediate results, which reinforces learning and helps you see the impact of your commands in real-time.
Visual Query Builders:
Many database management tools offer visual query builders, which allow users to build SQL queries by dragging and dropping elements. These tools can be helpful for beginners and make SQL more accessible.
Community Support:
SQL has a large and active community of developers and data analysts. The community provides support, shares knowledge, and helps newcomers with their questions, contributing to the ease of learning.
Despite its ease of learning, mastering SQL requires practice and experience, especially when dealing with complex queries and large datasets. However, with dedication and continuous use, even those with limited technical backgrounds can become proficient in SQL for data analysis.
How to learn sql step by step from scratch
1. Understand the Basics:
a. Introduction to Databases:
Familiarize yourself with the concept of databases and their importance in storing and managing data.
b. Relational Databases:
Learn about relational databases and how they organize data into tables.
c. Basic SQL Concepts:
Understand basic SQL concepts like tables, rows, columns, and relationships.
2. Set Up a Database:
a. Install a Database Management System (DBMS):
Choose a DBMS such as MySQL, PostgreSQL, SQLite, or Microsoft SQL Server.
Install and set up the chosen DBMS on your machine.
b. Create Your First Database:
Practice creating a simple database and tables.
3. Learn SQL Commands
a. Data Querying (SELECT):
Start with basic SELECT statements to retrieve data from tables.
b. Data Filtering (WHERE clause):
Learn how to filter data using the WHERE clause.
c. Sorting Data (ORDER BY):
Understand how to sort query results using the ORDER BY clause.
d. Data Modification (INSERT, UPDATE, DELETE):
Practice inserting, updating, and deleting data in tables.
e. Aggregate Functions (COUNT, SUM, AVG, MAX, MIN):
Explore functions for summarizing and aggregating data.
f. Grouping and Group Functions:
Learn about GROUP BY and HAVING clauses for grouping and filtering data.
4. Understand Joins:
a. Inner Joins:
Learn how to combine data from multiple tables using INNER JOIN.
b. Outer Joins:
Understand LEFT, RIGHT, and FULL OUTER JOIN for handling NULL values.
5. Advanced SQL Concepts:
a . Subqueries:
Explore subqueries and their use in SQL statements.
b. Indexes and Performance Optimization:
Learn about indexing for optimizing database performance.
c. Transactions and ACID Properties:
Understand transactions and the ACID properties (Atomicity, Consistency, Isolation, Durability).
d. Views:
Explore the creation and use of views for simplifying complex quer
6. Practice:
a. Use Sample Databases:
Work with sample databases to practice your skills.
b. Solve Real-world Problems:
Challenge yourself with real-world scenarios to apply your knowledge.
7. Online Resources and Courses:
a. Online Courses:
Enroll in online courses on platforms like Coursera, Udemy, or Khan Academy.
b. Documentation and Tutorials:
Refer to official documentation and tutorials provided by the chosen DBMS.
8. Join SQL Communities:
a. Forums and Q&A Sites:
Participate in SQL communities like Stack Overflow to learn from and help others.
9. Build Projects:
a. Apply Your Knowledge:
Build small projects to reinforce what you’ve learned.
23Sep, 2022
Best Data Analytics training in Dehradun Why to learn
[web_stories_embed url=”https://www.thevistaacademy.com/web-stories/best-data-analytics-training-in-dehradun-why-to-learn/” title=”Best Data Analytics training in Dehradun Why to learn” poster=”” width=”360″ height=”600″ align=”none”]
20Sep, 2022
Data Cleaning With Python for data analytics
[web_stories_embed url="https://www.thevistaacademy.com/web-stories/data-cleaning-with-python-for-data-analytics/" title="Data Cleaning With Python for data analytics" poster="https://www.thevistaacademy.com/wp-content/uploads/2022/08/cropped-cropped-logo-3-1.png" width="360" height="600" align="none"]
What is data cleaning
Data cleansing definition
Before conducting data analysis, a data set must be cleaned of any inaccurate, corrupt, or extraneous information.
By converting your messy, potentially troublesome data into clean data, data cleaning—also known as data cleansing, data scrubbing, and data preparation—serves to elaborate on the basic concept given above. That’s “clean data,” which is defined as information that the potent data analysis engines you invested in can truly utilize.
Additionally, and perhaps even more importantly, Python can be used to programme the great majority of datasets. Python’s significance is increased by the fact that data scientists use Numpy and Pandas, two Python libraries (i.e., pre-programmed toolsets), for data preparation and other types of analysis.What else is there to say? However, let’s get down to business and use these libraries to actually clean our data.
Python Data Cleaning
We will now guide you through the set of activities indicated below using Pandas and NumPy. We’ll offer a very brief overview of the assignment before describing the required code using the terms INPUT (what you should enter) and OUTPUT (what you should see as a result). Where applicable, we’ll also include notes and advice to assist you understand any confusing passages.
- The basic data cleansing chores that we’ll take on are as follows:
- Importing Libraries
- Input Customer Feedback Dataset
- Locate Missing Data
- Check for Duplicates
- Detect Outliers
Normalize Casing
Importing Libraries
Let’s get your Python script going with NumPy and Pandas installed.
INPUT:
import pandas as pd
import numpy as np
OUTPUT:
In this situation, the libraries should have been loaded into your script by this point. In our next step, you’ll input a dataset to verify whether this is the case.
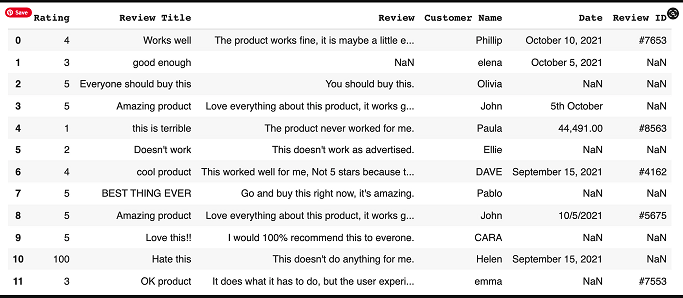
Enter the Dataset of Customer Feedback
The feedback dataset is then read by our libraries. Let’s have a look at that.
INPUT:
data = pd.read_csv(‘feedback.csv’)
As you can see, the dataset you wish to look at is “feedback.csv”. And in this instance, we know we are utilising the Pandas library to read our dataset as we see “pd.read csv” as the prior function.
Locate Missing Data
The isnull function, a sophisticated Python hack, will then be used to find our data. Actually a common function, “isnull” aids in locating missing items in our collection. This information is helpful since it shows what has to be fixed throughout the data cleaning process.
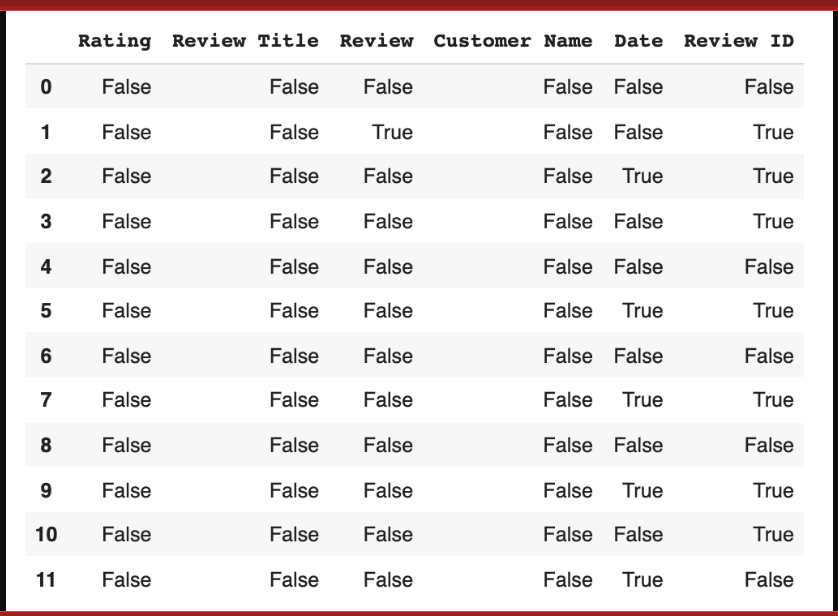
data.isnull()
We get a collection of boolean values as our output result.
The list can provide us with a variety of insights. The first thing to consider is where the missing data is; any column with a ‘True’ reading denotes that the data file’s category for that column contains missing data.
Datapoint 1 has missing information in its Review section and Review ID section, for instance (both are marked true).
Each feature’s missing data can be expanded further by coding:
Dropping the data
Another choice will need to be made: to maintain the data in the set while simply dropping the missing values, or to completely remove the feature (the entire column) because there are so many missing datapoints that it is unusable for analysis.
You must go in and label the missing values as void in accordance with Pandas or NumBy standards if you want to remove them (see section below). However, this is the code to remove the full column:
INPUT:
remove = [‘Review ID’,’Date’]
data.drop(remove, inplace =True, axis =1)
2. Input any missing data
Technically speaking, adding individual values using Pandas or NumBy standards is the same as adding missing data; we refer to it as adding “No Review.” When entering missing data, you have two options: manually enter the right information or add “No Review” using the code below.
INPUT:
data[‘Review’] = data[‘Review’].fillna(‘No review’)
Check for Duplicates
Similar to missing data, duplicates are problematic and choke analytics tools. Let’s find them and get rid of them.
In order to find duplicates, we start with:
data.duplicated()
data.drop_duplicates()
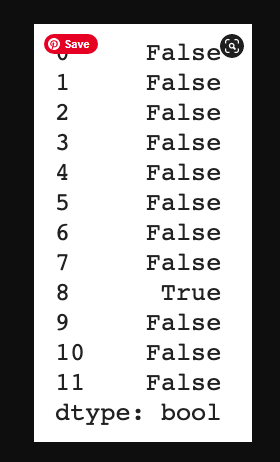
Detect Outliers
Outliers are numerical values that lie significantly outside of the statistical norm. Cutting that down from unnecessary science garble – they are data points that are so out of range they are likely misreads.
They, like duplicates, need to be removed. Let’s sniff out an outlier by first, pulling up our dataset.
INPUT:
data[‘Rating’].describe()
19Sep, 2022
Categories of SQL command to know for Data Analysis
SQL Command
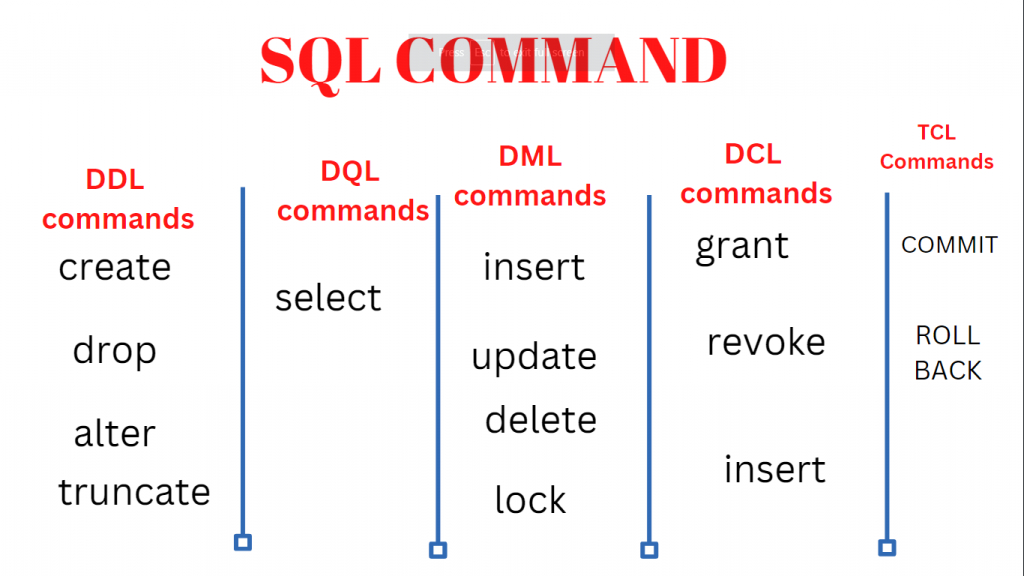
Relational databases can be managed and manipulated using the programming language SQL (Structured Query Language). Here are some crucial SQL command categories to be aware of for data analysis:
Data Definition Language (DDL)
what are the DDL commands?
DDL modifies the structure of the table by adding, removing, or changing tables, among other things.
All DDL commands are automatically committed, which permanently saves all database modifications.
The following commands are included in DDL:
Create
This command builds a new table and has a predefined syntax. The CREATE statement syntax is:
CREATE TABLE [table name] ([column definitions]) [table parameters];
For example:
CREATE TABLE employees (
    id INT PRIMARY KEY,
    name VARCHAR(100),
    salary DECIMAL(10, 2)
);
CREATE TABLE employees:
This part of the statement indicates that you are creating a new table named “employees.”
(id INT PRIMARY KEY,):
This line defines the first column of the table, named “id.”
INT specifies that it is an integer data type, meaning it will store whole numbers.
PRIMARY KEY indicates that the “id” column will be the primary key for the table. A primary key is a unique identifier for each record in the table.
(name VARCHAR(100),):
This line defines the second column of the table, named “name.”
VARCHAR(100) specifies that it is a variable character field, capable of storing up to 100 characters. This column is typically used for storing names or textual information.
(salary DECIMAL(10, 2)):
This line defines the third column of the table, named “salary.”
DECIMAL(10, 2) specifies a decimal data type with a total of 10 digits, where 2 digits are reserved for the decimal part. This is commonly used for storing monetary values.
In summary, the SQL statement is creating a table named “employees” with three columns: “id” for unique identification, “name” for storing names, and “salary” for storing decimal values such as salaries. The “id” column is designated as the primary key, ensuring each record in the table has a unique identifier.
Alter
An alter command modifies an existing database table. This command can add up additional column, drop existing columns and even change the data type of columns involved in a database table.
An alter command syntax is:
ALTER object type object name parameters;
For example:
ALTER TABLE employees
ADD department VARCHAR(50);
In this example, we added a unique primary key to the table to add a constraint and enforce a unique value. The constraint “employee_pk” is a primary key and is on the Employee table.
Drop
A drop command is used to delete objects such as a table, index or view. A DROP statement cannot be rolled back, so once an object is destroyed, there’s no way to recover it.
Drop statement syntax is:
DROP object type object name;
For example:
DROP TABLE employees;
In this example, we’re deleting the Employee table.
Truncate
Similar to DROP, the TRUNCATE statement is used to quickly remove all records from a table. However, unlike DROP that completely destroys a table, TRUNCATE preserves its full structure to be reused later.Truncate statement syntax is:
TRUNCATE TABLE table_name;
For example:
TRUNCATE TABLE employees;
COMMENT:
This statement allows you to add comments to a table or column, which can be useful for documentation purposes.
COMMENT ON COLUMN employees.salary IS 'The salary of the employee';
DQL Command
Data Query Language
DQL is used to fetch the data from the database.
A group of SQL commands known as Data Query Language (DQL) are used to extract data from databases. The DQL command that is used the most is SELECT. Here are a few DQL command examples:
Create table
CREATE TABLE employees (
    id INT PRIMARY KEY,
    name VARCHAR(100),
    salary DECIMAL(10, 2)
);
Insert Data
INSERT INTO employees (id, name, salary) VALUES
    (1, 'John Doe', 50000.00),
    (2, 'Jane Smith', 60000.00),
    (3, 'Michael Johnson', 55000.00),
    (4, 'Emily Williams', 62000.00),
    (5, 'Robert Brown', 48000.00),
    (6, 'Lisa Davis', 53000.00),
    (7, 'William Wilson', 58000.00),
    (8, 'Linda Taylor', 51000.00),
    (9, 'James Anderson', 54000.00),
    (10, 'Mary Martinez', 57000.00);
This command will inser data
Step 3: Retrieve All Data
SELECT * FROM employees;This query retrieves all rows and columns from the “employees” table.
Step 4: Retrieve Specific Columns
SELECT name, salary FROM employees;This query retrieves only the “name” and “salary” columns from the “employees” table.
Step 5: Filter Data
SELECT * FROM employees WHERE salary > 55000;
DML COMMAND
The database can be changed by using DML commands. It is in charge of making any kind of database modifications.
DML commands cannot permanently save all database changes since they are not auto-committed. They are rollbackable.
The four primary DML commands in SQL are as follows:
- INSERT Command
- UPDATE Command
- DELETE Command
UPDATE: Modify existing data.
-- Update John Doe's salary to $55000
UPDATE employees SET salary = 55000.00 WHERE name = 'John Doe';
DELETE: Remove rows from the table.
-- Delete the employee with ID 5
DELETE FROM employees WHERE id = 5;
INSERT INTO: Add new rows to the table.
-- Insert a new employee
INSERT INTO employees (id, name, salary) VALUES (11, 'Alex Johnson', 59000.00);
UPDATE Multiple Rows: You can update multiple rows at once.
-- Increase salary by 10% for employees with salary less than 55000
UPDATE employees SET salary = salary * 1.10 WHERE salary < 55000;
DELETE with Condition: Delete rows based on a condition.
-- Delete employees with a salary less than 50000
DELETE FROM employees WHERE salary < 50000;
INSERT Multiple Rows: Insert multiple rows at once.
-- Insert multiple employees
INSERT INTO employees (id, name, salary)
VALUES
    (12, 'Sarah Brown', 58000.00),
    (13, 'Thomas Miller', 53000.00);
Data Control Language (DCL)
To control access to database objects, use these instructions. GRANT and REVOKE are a couple of examples of commands in this group.DCL (Data Control Language) commands are used to control access to data within a database. They are primarily concerned with granting or revoking permissions and privileges to users. Here’s how you can use DCL commands on the “employees” table and dataset:
A person or group of users can be granted special rights with this command. The GRANT command has the following syntax:
GRANT
-- Grant SELECT privilege on the employees table to a user or role
GRANT SELECT ON employees TO username_or_role;
REVOKE: Remove privileges from users or roles.
-- Revoke SELECT privilege on the employees table from a user or role
REVOKE SELECT ON employees FROM username_or_role;
DCL commands are used to manage permissions, access control, and security within the database. Keep in mind that the specific syntax and implementation might vary depending on the database system you are using.
Transaction Control Language (TCL)
The management of transactions, which are collections of database activities that are handled as a single unit of work, is done using these commands. The commands COMMIT and ROLLBACK are examples of this class.
Transaction Control Language (TCL) consists of a set of SQL commands that control the transactions in a database. Transactions are sequences of one or more SQL statements that are executed as a single unit of work. TCL commands allow you to manage the changes made to a database during transactions. Here are the main TCL commands:
Commit
This command is used to permanently save changes made in the current transaction to the database. Once committed, the changes become permanent and visible to other transactions.COMMIT;
ROLLBACK:
This command is used to undo changes made in the current transaction. It reverts the database to the state it was in before the transaction began.ROLLBACK;
SAVEPOINT:
A savepoint marks a specific point within a transaction to which you can later roll back. It allows you to selectively undo parts of a transaction while leaving other parts intact.SAVEPOINT sp1;
ROLLBACK TO SAVEPOINT:
This command undoes changes made after a specific savepoint within a transaction.RELEASE SAVEPOINT sp1;TCL commands are crucial for maintaining data integrity, managing concurrent transactions, and ensuring that changes to the database are controlled and consistent. By using these commands effectively, you can handle transactions in a way that aligns with your application’s requirements and maintains the reliability of your data.
Answer: The SQL SELECT statement is used to retrieve data from one or more tables. It allows you to specify which columns to retrieve and apply filtering conditions using the WHERE clause.
Answer: You can filter rows from a table using the WHERE clause in conjunction with the SELECT statement. The WHERE clause allows you to specify conditions that the rows must meet to be included in the result set.
Answer: The GROUP BY clause is used to group rows with similar values in specified columns. It’s often used in combination with aggregate functions to perform calculations on grouped data.
Answer: The INNER JOIN returns only the matching rows from both tables based on the specified condition. On the other hand, the LEFT JOIN returns all the rows from the left table and the matching rows from the right table. If there’s no match, NULL values are returned for the right table’s columns.
Answer: You can calculate the average of a specific column using the AVG aggregate function in combination with the SELECT statement and optionally the GROUP BY clause.
Answer: The SQL INSERT statement is used to add new rows into a table. It allows you to specify the values for each column in the new row.
Answer: A primary key is a column or a set of columns that uniquely identify each row in a table. It ensures data integrity by preventing duplicate or null values in the key columns.
Answer: The ORDER BY clause is used to sort the result set of a query based on one or more columns. You can specify the sorting order (ascending or descending) for each column.
The SQL ALTER TABLE statement is used to modify the structure of an existing table, such as adding or dropping columns, changing data types, or adding constraints.
A subquery is a nested query that can be used within another query. It can be employed to retrieve data that will be used for filtering, calculations, or comparisons in the outer query. Subqueries are enclosed in parentheses and can appear in various parts of a SQL statement, such as the WHERE clause or the FROM clause.
13Sep, 2022
Data Analyst vs. Business Analyst: What’s the Difference?
[web_stories_embed url="https://www.thevistaacademy.com/web-stories/data-analyst-vs-business-analyst-whats-the-difference/" title="Data Analyst vs. Business Analyst: What’s the Difference?" poster="https://www.thevistaacademy.com/wp-content/uploads/2022/08/cropped-cropped-logo-3-1.png" width="360" height="600" align="none"]
A contrast of business analytics and data analytics
Most people concur that the ultimate purpose of business and data analytics is to use technology and data to improve business performance. In a data-driven world where enterprises have access to an exponentially growing amount of information, the two tasks may even cooperate to increase efficiency, provide insightful data, and support the growth of businesses.
The differences between business and data analytics should be more clearly understood as a result of this side-by-side comparison.
Business analyst vs. data analyst: A comparison of roles
Both data analysts and business analysts use data. What they do with it is what makes a difference. Data is used by business analysts to make strategic business decisions. Data analysts acquire data, process it, extract information that is helpful, and distil their findings into easily understandable insights. Their final objective is data analysis.
Both roles call for candidates to have a passion for data, an analytical mindset, strong problem-solving abilities, and the capacity to see and work toward the greater picture. But it’s equally crucial to know how these two professional routes differ if you’re trying to choose between them.
While data analysts need strong business intelligence and data mining abilities as well as expertise with in-demand technologies like machine learning and AI, business analysts must be skilled in modelling and requirements gathering.
A strong foundation in business administration is a major asset for business analysts. Business management, business, IT, computer science, and other related subjects are the backgrounds of many business analysts. On the other hand, data analysts need to grasp intricate statistics, algorithms, and databases, so they would benefit from having a background in math or information technology.
An intro to business analytics
Business analytics (BA) is the iterative exploration of an organization’s data with the goal of revealing information that can help drive innovation and financial performance. Analytics-driven businesses view big data as a valuable corporate asset that fuels business planning and supports future strategies, and business analytics assists them in extracting the most value from this goldmine of insights.
Business analytics can be classified into three types: descriptive, predictive, and prescriptive. These are typically implemented in stages and, when combined, can answer or solve almost any question or problem that a company may have.
Descriptive analytics provides an answer to the question, “What happened?”
- “This type of analytics examines historical data to gain insights into future planning.” Because self-service data access and discovery tools and dashboards are widely available, executives and non-technical professionals can benefit from big data insights to improve business performance.
- The next step on the path to insight is predictive analytics. It employs machine learning and statistical techniques to assist businesses in predicting the likelihood of future events. However, because predictive analytics is probabilistic in nature, it cannot predict the future; it can only suggest the most likely outcome based on past events.
- Prescriptive analytics investigates potential actions based on descriptive and predictive analysis results. This type of analytics combines mathematical models and business rules to optimise decision making by recommending multiple responses to various scenarios and tradeoffs.
Most commonly-used data analysis techniques have been automated to speed the analytical process. Thanks to the widespread availability of powerful analytics platforms, data analysts can sort through huge amounts of data in minutes or hours instead of days or weeks using:
The majority of regularly used data analysis procedures have been automated in order to speed up the analytical process. Because powerful analytics tools are widely available, data analysts can go through massive amounts of data in minutes or hours rather than days or weeks using:
Data mining is the process of searching through enormous data sets in order to uncover trends, patterns, and relationships.
Predictive analytics collects and analyses historical data to assist firms in responding properly to future events such as customer behaviour and equipment problems.
Machine learning: The use of statistical probability to educate computers to process data more quickly than traditional analytical modelling.
Data mining, predictive analytics, and machine learning methods are used in big data analytics to translate data into business intelligence.
Text mining is the detection of patterns and sentiments in papers, emails, and other text-based content.
Data Analyst VS Business Analyst
Data Analyst | Business Analyst |
focuses on digging into and understanding vast datasets in order to find insights and trends. | Focuses on comprehending corporate processes and finding areas for development |
Collects, cleans, and prepares data for analysis. | Assembles and records business requirements obtained from key players. |
Utilizes statistical and data analysis techniques to identify trends and make data-driven recommendations. | Applies business analysis techniques to develop strategies and solutions for business challenges |
Works primarily with quantitative data and employs tools like SQL, Python, or R for analysis | Works with qualitative and quantitative data, using tools like flowcharts and diagrams for process analysis. |
locates data sources, performs data quality evaluations, and guarantees data accuracy. | performs gap analysis, confirms alignment with business goals, and validates the business needs. |
develops reports and visualization’s to effectively convey findings. | creates documentation such as user stories and business requirement documents. |
collaborates with stakeholders to grasp their analytical needs and provide practical information. | Collaborates with stakeholders to understand business goals and provide solutions for process improvement. |
Develops predictive models and conducts forecasting to support strategic decision-making. | Facilitates requirements gathering sessions and leads discussions with stakeholders. |
implements data-driven strategies to enhance productivity and business processes. | Implements business process improvements and supports change management initiatives |
helps with data management and governance tasks to keep data integrity. | Assists in identifying and analyzing business risks and proposing risk mitigation strategies. |
understand how to present data visually using tools like Tableau, Power BI, or matplotlib. | Proficient in business analysis tools like Microsoft Visio or Enterprise Architect for process mapping and modeling. |
concentrates on the technical components of data analysis, such as data extraction, transformation, and loading (ETL) | focuses on comprehending and converting into technical specifications the functional needs of a system. |
Monitors and tracks key performance indicators (KPIs) to measure the success of data-driven initiatives. | Assesses and monitors key performance indicators (KPIs) to measure the effectiveness of business processes. |
Conducts exploratory data analysis to identify trends, outliers, and correlations within datasets. | Conducts business process analysis to identify bottlenecks, inefficiencies, and opportunities for improvement. |
To ensure data accessibility and model quality, actively collaborate with data engineers and data scientists. | To guarantee that system requirements are satisfied and solutions are effectively deployed, collaborates with IT teams and stakeholders. |
gives information on market trends, consumer behaviour, and product performance. | provides information on market opportunities, company strategy, and competition assessments. |
uses A/B tests and data-driven experiments to put changes to the test. | supports process reengineering activities and business process improvement initiatives. |
keeps abreast of the most recent technologies, techniques, and market trends in data analysis. | keeps up with the most recent frameworks, techniques, and best practises in business analysis |
as well as good programming, statistical, and analytical abilities. | Can transition into roles like Product Manager, Project Manager, or Systems Analyst with additional training and experience. |

Data Analyst 10 POINTS
1.Data Analysis:
ability to analyse massive datasets, spot trends, and draw out valuable insights to support data-driven decision-making.
2.Data Manipulation:
knowledgeable about the collection, cleaning, and conversion of raw data into formats that may be used, such as SQL, Python, or R.
3.Statistical Analysis:
knowledge of how to use statistical methods to help decision-making processes, including regression analysis and hypothesis testing.
4.Data Visualization:
ability to effectively convey findings to stakeholders by using technologies like Tableau, Power BI, or matplotlib to create visually appealing and educational data visualisations.
5.Data Quality Assurance:
able to assure data veracity, conduct data quality evaluations, and use data governance procedures to maintain data integrity.
6.Problem-Solving:
To identify difficult business problems, create hypotheses, and extract practical solutions based on data analysis, you need strong analytical and critical thinking skills.
7.Business Acumen:
Understanding of business goals and procedures makes it possible to translate data insights into actionable suggestions for process optimisation and strategic decision-making.
8.Programming Skills:
able to construct effective queries, automate data processes, and carry out sophisticated data analysis. Proficient in programming languages such as Python, SQL, or R.
9. Tools and Technologies:
the capacity to quickly learn new technologies and software, as well as familiarity with data analysis and visualisation tools like Excel, Tableau, Power BI, or Google Analytics.
10.Communication and Collaboration:
Strong interpersonal and communication abilities are necessary to work productively with cross-functional teams, convey findings to non-technical audiences, and succinctly explain difficult data concepts.
.

Business Analyst 10 POINTS
1.Business Requirements Gathering:
capable of conducting seminars, surveys, and interviews to elicit and document comprehensive business requirements from stakeholders.
2.Process Analysis:
capable of analysing and describing existing business processes, locating pain points, bottlenecks, and potential development areas.
3.Stakeholder Collaboration:
Strong ability to work together with stakeholders across departments to comprehend their wants, close communication gaps, and guarantee that provided solutions are aligned with business goals.
4.Business Process Modeling:
knowledge of how to develop process flowcharts, diagrams, and models that represent current and future business processes using software like Microsoft Visio or Enterprise Architect.
5. Requirement Documentation:
able to clearly and concisely document business requirements, user stories, use cases, and functional specifications.
6. Problem-Solving:
Strong analytical and problem-solving abilities to recognise business issues, analyse their causes, and put forth creative solutions that are in line with organisational objectives.
7.Change Management:
a working knowledge of change management principles and the capacity to influence organisational change by convincing stakeholders of the advantages and effects of suggested solutions.
8.Data Analysis:
Ability to work with data to find trends, correlations, and insights that help business decision-making. Basic understanding of data analysis concepts.
9.Business Case Development:
knowledgeable about creating business cases that detail the costs, advantages, and risks connected with suggested solutions, assisting stakeholders in making decisions.
10.Communication and Presentation:
Excellent communication and presentation skills to convey complex information, facilitate meetings, and deliver impactful presentations to both technical and non-technical audiences.
In summary
Data Analytics is about examining data to find patterns and insights.
Business Analytics takes those insights and applies them strategically to achieve specific business objectives.
Analogy:
Think of data analytics as a detective analyzing clues at a crime scene (data) to understand what happened. Business analytics is like the police chief using that information to make decisions on how to improve overall crime prevention strategies.
In essence, data analytics is about understanding the “what,” and business analytics is about understanding the “so what” and “now what” in a business context.
Business analytics primarily focuses on applying data-driven insights to solve specific business problems and improve decision-making. Data analytics, on the other hand, is more centered on processing and analyzing data to uncover patterns, trends, and relationships.
Business analytics aims to provide actionable recommendations for addressing business challenges, while data analytics aims to extract insights from data without necessarily prescribing specific actions.
Business analytics often uses a problem-centric approach, focusing on answering specific business questions using data. Data analytics takes a more exploratory approach, seeking patterns and correlations in data that may not have a predefined question.
While both can involve predictive modeling, data analytics tends to have a stronger emphasis on forecasting future trends and outcomes, as it seeks to uncover patterns that can lead to predictions.
Business analytics directly influences managerial decisions by providing actionable insights and recommendations for specific business problems. Data analytics provides insights that can inform decision-making but might not necessarily prescribe specific actions.