5 Key Stages (Five Steps of Data Science) — Data Science Process Overview

A clear, practical roadmap for solving real business problems with data. Follow these five steps of data science to move from a problem statement to a production-ready solution.

Five Steps of Data Science Process – Vista Academy

📈 Visual Guide: Five Stages of Data Science Workflow (Vista Academy)

Quick Overview

Define → Collect → Prepare → Model → Deploy — repeat with monitoring.

Who is this for?

Beginners, stakeholders, product teams, and aspiring data practitioners.

Core keyphrase

five steps of data science — use this phrase naturally in headings and first paragraph.

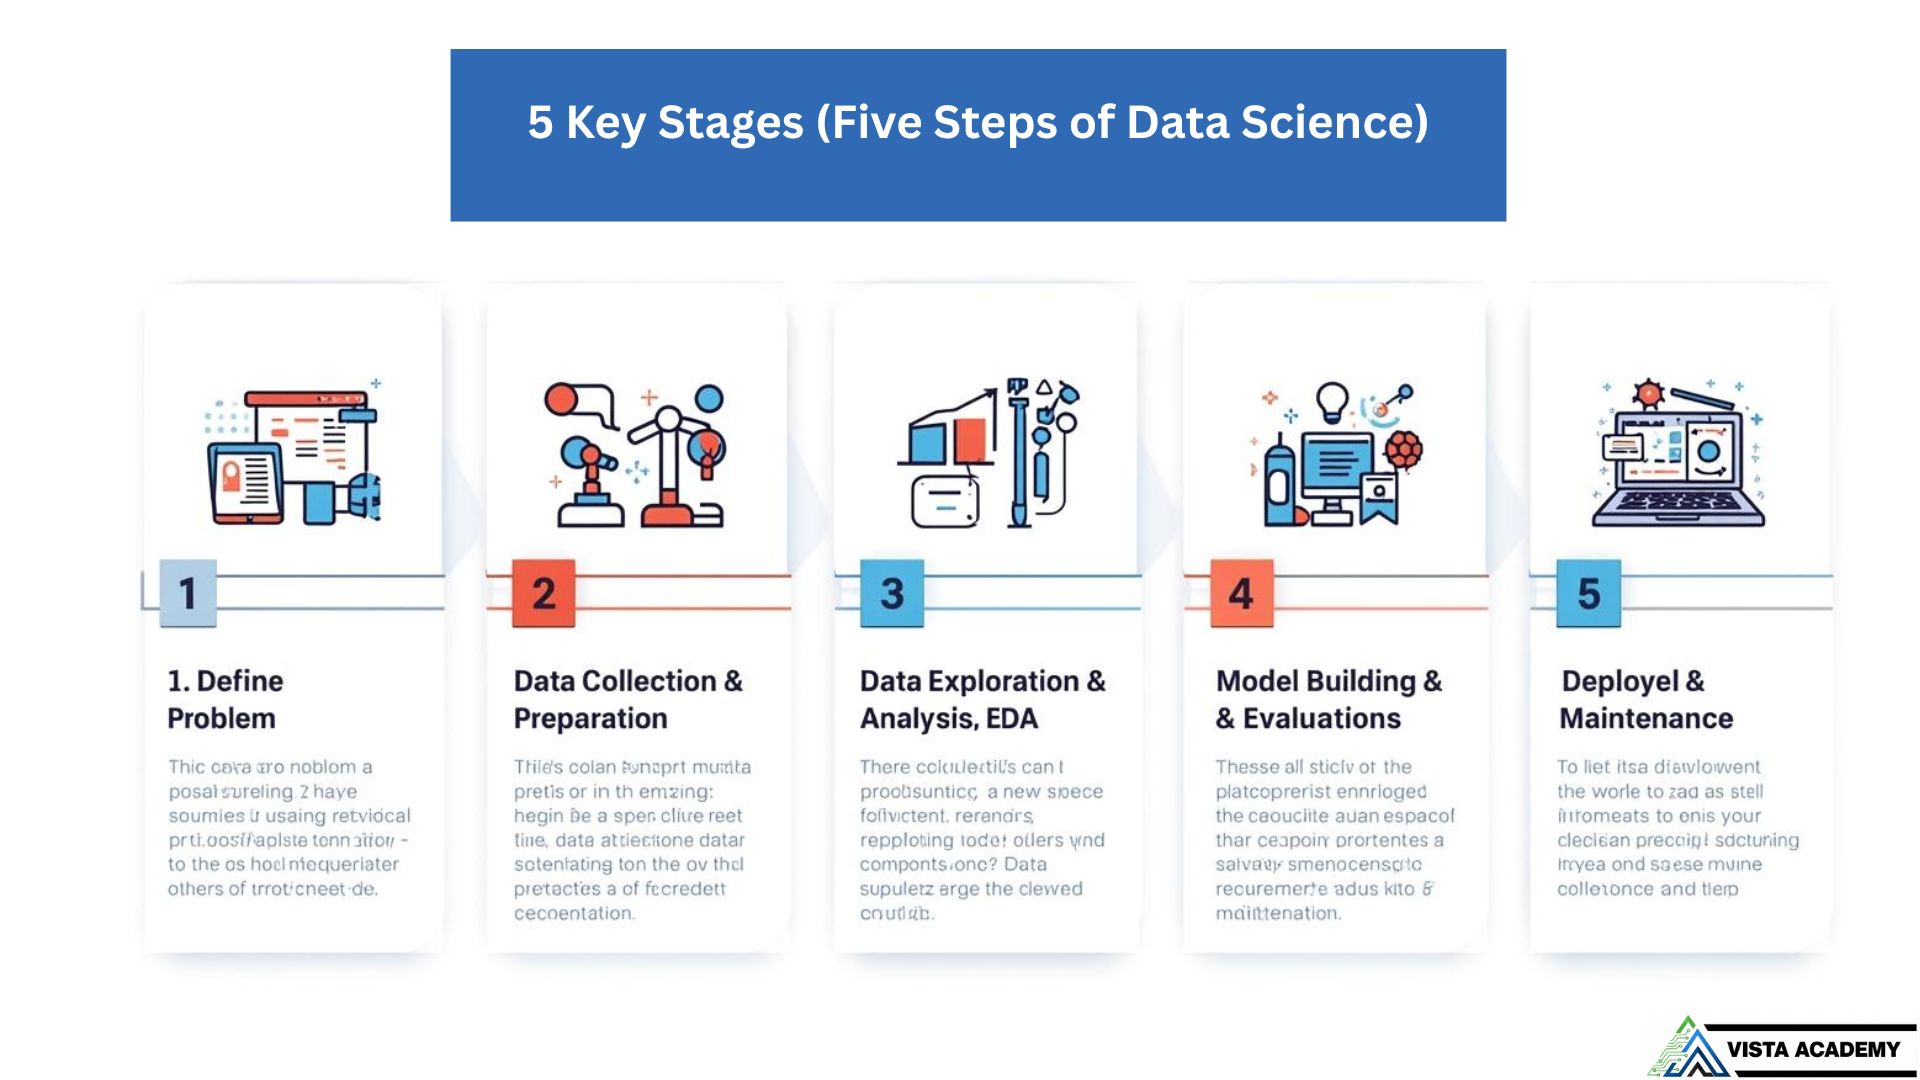
1. Define the Problem

Start with a clear business question. Identify stakeholders, success metrics (KPIs), constraints and the expected impact. A well-defined problem prevents wasted effort later.

  • What decision must this model inform?
  • Who will use the output and how will success be measured?

2. Data Collection & Preparation

Gather data from product logs, databases, APIs or external sources. Then clean, handle missing values, and document lineage. This phase is critical — many searchers ask where cognitive empathy matters, and it matters most here.

Tip: Add a data dictionary and note sources for reproducibility.

3. Data Exploration & Analysis (EDA)

Explore distributions, correlations and outliers. Visualize patterns and check for bias. EDA helps form better modeling strategies and uncovers data quality issues early.

4. Model Building & Evaluation

Choose algorithms, train with cross-validation, and evaluate using relevant metrics. Compare baseline models and include explainability checks before selecting the final model.

5. Deployment & Maintenance

Deploy to production, monitor performance, set up alerts, and retrain on new data. Consider rollback plans and user feedback loops to keep your solution effective.

Problem Definition — The Foundation of Data Science Success

The first and most critical step in the five steps of data science is defining the problem clearly. Without this, even great models can miss the mark.

Understand the Problem

Work with stakeholders to define the exact question. Example: “Reduce churn” → specify churn definition and business impact.

Define Objectives

Set measurable KPIs (e.g., 85% prediction accuracy or +20% retention in 6 months) and decide success criteria up front.

Identify Constraints

Note time, budget, data availability and compliance limits (e.g., only 3 months, limited history, PII rules).

Collaborate with Stakeholders

Align expectations early — marketing may want insights while product needs predictions. Resolve ownership & delivery format now.

Taking time here reduces rework later. Document the problem statement, stakeholders, KPIs, and a short scope note — add this to your project README or data dictionary.

Data Collection — Gathering the Right Information

The second phase in the five steps of data science is Data Collection. Accurate and relevant data is the foundation of every successful data science project. This step ensures you gather diverse, high-quality information for deeper analysis and model building.

Identify Relevant Data Sources

Start by identifying where your data will come from — internal databases, CRM systems, APIs, or open data portals. For example, predicting product sales might need sales logs, competitor data, and social media trends.

APIs: Streamlining Data Collection

APIs (Application Programming Interfaces) simplify automated data collection. Platforms like Twitter or Google Analytics offer APIs for sentiment, engagement, or user traffic analysis.

Web Scraping for Rich Insights

When data isn’t available via APIs, web scraping helps extract structured information such as product details, reviews, or prices from websites using Python libraries like BeautifulSoup or Scrapy.

Ensuring Data Variety & Volume

Combine structured data (e.g., sales, revenue) with unstructured data (e.g., customer reviews, text, or images). This improves context and model robustness — a key part of the data science process overview.

By gathering diverse and reliable data, you prepare the ground for strong insights and modeling success. Always confirm that collected data aligns with your defined business goals.

Data Exploration & Analysis — Uncover Patterns and Insights

The third phase in the five steps of data science is Exploratory Data Analysis (EDA). Use EDA to find structure, spot anomalies, and shape modelling choices.

Exploratory Data Analysis (EDA)

Explore distributions, correlations, missing values and basic summary statistics to form hypotheses and detect data quality issues early.

  • Summary stats: mean, median, std, missing counts
  • Relationships: correlation matrix, group comparisons
  • Data quality: missingness patterns, duplicates

Visualization

Visuals—histograms, scatter plots, box plots, and heatmaps—make hidden patterns obvious and help communicate findings to non-technical stakeholders.

Note: Use plots to check skew, multimodality and group differences before modelling.

Anomalies & Bias

Detect outliers, sampling biases, and imbalances that could mislead models or stakeholders.

  • Outliers: investigate—are they errors or real extremes?
  • Imbalance: check class balance for classification tasks
  • Bias: trace how collection methods influenced the data
Quick Python EDA snippet (pandas)
# load & quick summary
import pandas as pd
df = pd.read_csv('data.csv')
print(df.shape)
print(df.describe(include='all'))
print(df.isna().sum())

# simple plots (Jupyter)
df.hist(figsize=(10,8))
pd.plotting.scatter_matrix(df.select_dtypes(include='number'), figsize=(12,10))
      

Thorough exploration informs model choice and improves interpretability. When EDA is done well, modelling becomes faster and more reliable.

Model Building & Evaluation — Creating and Optimizing Predictive Models

The fourth phase in the five steps of data science focuses on developing predictive or descriptive models, testing them, and refining for accuracy. Here’s how you move from data to decision-making.

Building Predictive or Descriptive Models

Select a model that fits your problem — regression/classification for predictions, clustering for grouping patterns. Example: Logistic Regression for churn prediction, K-Means for customer segmentation.

Evaluate Model Performance

Use evaluation metrics suited to your goal. Classification → Precision, Recall, F1-score, ROC-AUC Regression → MAE, MSE, R² Always split data into train/test sets to avoid overfitting.

Fine-Tune for Optimal Results

Improve results through hyperparameter tuning and feature engineering. Use GridSearchCV, RandomizedSearchCV or libraries like Optuna for optimization. Feature scaling (e.g., StandardScaler) helps algorithms like SVM or KNN.

Tools for Model Building & Evaluation

Popular tools include Scikit-learn for ML, TensorFlow & PyTorch for deep learning, and MLflow for experiment tracking. Use cross-validation for reliable generalization checks.

Quick Python Example (Scikit-learn Workflow)
from sklearn.model_selection import train_test_split, GridSearchCV
from sklearn.ensemble import RandomForestClassifier
from sklearn.metrics import classification_report

# Split data
X_train, X_test, y_train, y_test = train_test_split(X, y, test_size=0.2, random_state=42)

# Build model
model = RandomForestClassifier(random_state=42)
model.fit(X_train, y_train)

# Evaluate
y_pred = model.predict(X_test)
print(classification_report(y_test, y_pred))

# Fine-tune with grid search
params = {'n_estimators':[100,200], 'max_depth':[None,10,20]}
grid = GridSearchCV(model, params, cv=3)
grid.fit(X_train, y_train)
print("Best Params:", grid.best_params_)
      

Model building and evaluation are iterative. With each cycle of testing and tuning, your model gets smarter, more accurate, and closer to solving the real business problem effectively.

Deployment & Maintenance — Keeping Your Data Science Solution Alive

The final stage in the five steps of data science ensures your model delivers real-world value. This phase focuses on deploying, monitoring, and maintaining your data science system for reliability and scalability.

Deployment

Move your model into production so it can deliver predictions in real-time or batch mode. Common deployment strategies include:

  • Deploy via Flask / FastAPI web apps for REST endpoints.
  • Integrate models into dashboards using Power BI or Streamlit.
  • Use MLOps tools (like AWS Sagemaker, Vertex AI, or MLflow) for automation and scalability.

Monitoring

After deployment, continuously track your model’s health and performance. Key actions include:

  • Monitor KPIs like accuracy, latency, and uptime.
  • Detect data drift or concept drift using automated alerts.
  • Log inputs, outputs, and errors for audit and retraining.

Maintenance

Keep your solution relevant as business goals and data evolve:

  • Retrain models with new or seasonal data.
  • Fix pipeline issues, bugs, or slowdowns.
  • Update dashboards and documentation regularly.
Quick Example — Deploying with Flask (Python)
from flask import Flask, request, jsonify
import pickle

app = Flask(__name__)
model = pickle.load(open('model.pkl', 'rb'))

@app.route('/predict', methods=['POST'])
def predict():
    data = request.get_json()
    prediction = model.predict([data['features']])
    return jsonify({'prediction': int(prediction[0])})

if __name__ == '__main__':
    app.run(debug=True)
      

Continuous improvement keeps your data-driven solution relevant and trustworthy. With strong deployment and maintenance, your project evolves alongside business needs — marking the final victory in the five steps of data science.

Vista Academy – 316/336, Park Rd, Laxman Chowk, Dehradun – 248001
📞 +91 94117 78145 | 📧 thevistaacademy@gmail.com | 💬 WhatsApp
💬 Chat on WhatsApp: Ask About Our Courses